Install ELK with beats to gather metrics
- tags
-
openstack, ansible
About this repository
This set of playbooks will deploy an elastic stack cluster (Elasticsearch, Logstash, Kibana) with beats to gather metrics from hosts and store them into the elastic stack.
These playbooks require Ansible 2.5+.
Highlevel overview of the Elastic Stack infrastructure these playbooks will build and operate against.

OpenStack-Ansible Integration
These playbooks can be used as standalone inventory or as an integrated part of an OpenStack-Ansible deployment. For a simple example of standalone inventory, see [test-inventory.yml](tests/inventory/test-inventory.yml).
Optional | Load balancer configuration
- Configure the Elasticsearch endpoints:
-
While the Elastic stack cluster does not need a load balancer to scale, it is useful when accessing the Elasticsearch cluster using external tooling. Tools like OSProfiler, Grafana, etc will all benefit from being able to interact with Elasticsearch using the load balancer. This provides better fault tolerance especially when compared to connecting to a single node. The following section can be added to the haproxy_extra_services list to create an Elasticsearch backend. The ingress port used to connect to Elasticsearch is 9201. The backend port is 9200. If this backend is setup make sure you set the internal_lb_vip_address on the CLI or within a known variable file which will be sourced at runtime. If using HAProxy, edit the /etc/openstack_deploy/user_variables.yml file and add the following lines.
haproxy_extra_services:
  - service:
      haproxy_service_name: elastic-logstash
      haproxy_ssl: False
      haproxy_backend_nodes: "{{ groups['Kibana'] | default([]) }}"  # Kibana nodes are also Elasticsearch coordination nodes
      haproxy_port: 9201  # This is set using the "elastic_hap_port" variable
      haproxy_check_port: 9200  # This is set using the "elastic_port" variable
      haproxy_backend_port: 9200  # This is set using the "elastic_port" variable
haproxy_balance_type: tcp- Configure the Kibana endpoints:
-
It is recommended to use a load balancer with Kibana. Like Elasticsearch, a load balancer is not required however without one users will need to directly connect to a single Kibana node to access the dashboard. If a load balancer is present it can provide a highly available address for users to access a pool of Kibana nodes which will provide a much better user experience. If using HAProxy, edit the /etc/openstack_deploy/user_variables.yml file and add the following lines.
haproxy_extra_services:
  - service:
      haproxy_service_name: Kibana
      haproxy_ssl: False
      haproxy_backend_nodes: "{{ groups['Kibana'] | default([]) }}"
      haproxy_port: 81  # This is set using the "Kibana_nginx_port" variable
haproxy_balance_type: tcp- Configure the APM endpoints:
-
It is recommented to use a load balancer for submitting Application Performance Monitoring data to the APM server. A load balancer will provide a highly available address which APM clients can use to connect to a pool of APM nodes. If using HAProxy, edit the /etc/openstack_deploy/user_variables.yml and add the following lines
haproxy_extra_services:
  - service:
      haproxy_service_name: apm-server
      haproxy_ssl: False
      haproxy_backend_nodes: "{{ groups['apm-server'] | default([]) }}"
      haproxy_port: 8200 # this is set using the "apm_port" variable
      haproxy_balance_type: tcp
Optional | add OSProfiler to an OpenStack-Ansible deployment
To initialize the OSProfiler module within openstack the following overrides can be applied to a user variables file. The hmac key needs to be defined consistently throughout the environment.
Full example to initialize the OSProfiler modules throughout an OpenStack-Ansible deployment.
profiler_overrides: &os_profiler
  profiler:
    enabled: true
    trace_sqlalchemy: true
    hmac_keys: "UNIQUE_HMACKEY"  # This needs to be set consistently throughout the deployment
    connection_string: "Elasticsearch://{{ internal_lb_vip_address }}:9201"
    es_doc_type: "notification"
    es_scroll_time: "2m"
    es_scroll_size: "10000"
    filter_error_trace: "false"

aodh_aodh_conf_overrides: *os_profiler
barbican_config_overrides: *os_profiler
ceilometer_ceilometer_conf_overrides: *os_profiler
cinder_cinder_conf_overrides: *os_profiler
designate_designate_conf_overrides: *os_profiler
glance_glance_api_conf_overrides: *os_profiler
gnocchi_conf_overrides: *os_profiler
heat_heat_conf_overrides: *os_profiler
horizon_config_overrides: *os_profiler
ironic_ironic_conf_overrides: *os_profiler
keystone_keystone_conf_overrides: *os_profiler
magnum_config_overrides: *os_profiler
neutron_neutron_conf_overrides: *os_profiler
nova_nova_conf_overrides: *os_profiler
octavia_octavia_conf_overrides: *os_profiler
rally_config_overrides: *os_profiler
sahara_conf_overrides: *os_profiler
swift_swift_conf_overrides: *os_profiler
tacker_tacker_conf_overrides: *os_profiler
trove_config_overrides: *os_profiler
If a deployer wishes to use multiple keys they can do so by specifying a comma separated list.
profiler_overrides: &os_profiler
  profiler:
    hmac_keys: "key1,key2"
To add the OSProfiler section to an exist set of overrides, the yaml section can be added or dynamically appended to a given hash using yaml tags.
profiler_overrides: &os_profiler
  profiler:
    enabled: true
    hmac_keys: "UNIQUE_HMACKEY"  # This needs to be set consistently throughout the deployment
    connection_string: "Elasticsearch://{{ internal_lb_vip_address }}:9201"
    es_doc_type: "notification"
    es_scroll_time: "2m"
    es_scroll_size: "10000"
    filter_error_trace: "false"

# Example to merge the os_profiler tag to into an existing override hash
nova_nova_conf_overrides:
  section1_override:
    key: "value"
  <<: *os_profiler
While the osprofiler and Elasticsearch libraries should be installed within all virtual environments by default, it's possible they're missing within a given deployment. To install these dependencies throughout the cluster without having to invoke a repo-build run the following adhoc Ansible command.
The version of the Elasticsearch python library should match the major version of of Elasticsearch being deployed within the environment.
ansible -m shell -a 'find /openstack/venvs/* -maxdepth 0 -type d -exec {}/bin/pip install osprofiler "elasticsearch>=6.0.0,<7.0.0" --isolated \;' allOnce the overrides are in-place the openstack-ansible playbooks will need to be rerun. To simply inject these options into the system a deployer will be able to use the *-config tags that are apart of all os_* roles. The following example will run the config tag on ALL openstack playbooks.
openstack-ansible setup-openstack.yml --tags "$(cat setup-openstack.yml | grep -wo 'os-.*' | awk -F'-' '{print $2 "-config"}' | tr '\n' ',')"Once the OSProfiler module has been initialized tasks can be profiled on demand by using the --profile or --os-profile switch in the various openstack clients along with one of the given hmac keys defined.
Legacy profile example command.
glance --profile key1 image-listModern profile example command, requires python-openstackclient >= 3.4.1 and the osprofiler library.
openstack --os-profile key2 image listIf the client library is not installed in the same path as the python-openstackclient client, run the following command to install the required library.
pip install osprofilerOptional | run the haproxy-install playbook
cd /opt/openstack-ansible/playbooks/
openstack-ansible haproxy-install.yml --tags=haproxy-service-config
Setup | system configuration
Clone the elk-osa repo
cd /opt
git clone https://github.com/openstack/openstack-ansible-ops
Copy the env.d file into place
cd /opt/openstack-ansible-ops/elk_metrics_6x
cp env.d/elk.yml /etc/openstack_deploy/env.d/
Copy the conf.d file into place
cp conf.d/elk.yml /etc/openstack_deploy/conf.d/In elk.yml, list your logging hosts under elastic-logstash_hosts to create the Elasticsearch cluster in multiple containers and one logging host under kibana_hosts to create the Kibana container
vi /etc/openstack_deploy/conf.d/elk.ymlCreate the containers
cd /opt/openstack-ansible/playbooks
openstack-ansible lxc-containers-create.yml --limit elk_all
Deploying | Installing with embedded Ansible
If this is being executed on a system that already has Ansible installed but is incompatible with these playbooks the script bootstrap-embedded-ansible.sh can be sourced to grab an embedded version of Ansible prior to executing the playbooks.
source bootstrap-embedded-ansible.shDeploying | Manually resolving the dependencies
This playbook has external role dependencies. If Ansible is not
installed with the bootstrap-ansible.sh
script these dependencies can be resolved with the
ansible-galaxy command and the
ansible-role-requirements.yml file.
- Example galaxy execution
ansible-galaxy install -r ansible-role-requirements.ymlOnce the dependencies are set make sure to set the action plugin path to the location of the config_template action directory. This can be done using the environment variable ANSIBLE_ACTION_PLUGINS or through the use of an ansible.cfg file.
Deploying | The environment
Install master/data Elasticsearch nodes on the elastic-logstash containers, deploy Logstash, deploy Kibana, and then deploy all of the service beats.
cd /opt/openstack-ansible-ops/elk_metrics_6x
ansible-playbook site.yml $USER_VARS- The openstack-ansible command can be used if the version of ansible on the system is greater than 2.5. This will automatically pick up the necessary group_vars for hosts in an OSA deployment.
- If required add
-e@/opt/openstack-ansible/inventory/group_vars/all/all.ymlto import sufficient OSA group variables to define the OpenStack release. Journalbeat will then deploy onto all hosts/containers for releases prior to Rocky, and hosts only for Rocky onwards. If the variableopenstack_releaseis undefined the default behaviour is to deploy Journalbeat to hosts only. - Alternatively if using the embedded ansible, create a symlink to include all of the OSA group_vars. These are not available by default with the embedded ansible and can be symlinked into the ops repo.
ln -s /opt/openstack-ansible/inventory/group_vars /opt/openstack-ansible-ops/elk_metrics_6x/group_varsThe individual playbooks found within this repository can be independently run at anytime.
Architecture | Data flow
This diagram outlines the data flow from within an Elastic Stack deployment.

Optional | Enable uwsgi stats
Config overrides can be used to make uwsgi stats available on unix domain sockets. Any /tmp/*uwsgi-stats.sock will be picked up by Metricsbeat.
keystone_uwsgi_ini_overrides:
  uwsgi:
    stats: "/tmp/keystone-uwsgi-stats.sock"

cinder_api_uwsgi_ini_overrides:
  uwsgi:
    stats: "/tmp/cinder-api-uwsgi-stats.sock"

glance_api_uwsgi_ini_overrides:
  uwsgi:
    stats: "/tmp/glance-api-uwsgi-stats.sock"

heat_api_uwsgi_ini_overrides:
  uwsgi:
    stats: "/tmp/heat-api-uwsgi-stats.sock"

heat_api_cfn_init_overrides:
  uwsgi:
    stats: "/tmp/heat-api-cfn-uwsgi-stats.sock"

nova_api_metadata_uwsgi_ini_overrides:
  uwsgi:
    stats: "/tmp/nova-api-metadata-uwsgi-stats.sock"

nova_api_os_compute_uwsgi_ini_overrides:
  uwsgi:
    stats: "/tmp/nova-api-os-compute-uwsgi-stats.sock"

nova_placement_uwsgi_ini_overrides:
  uwsgi:
    stats: "/tmp/nova-placement-uwsgi-stats.sock"

octavia_api_uwsgi_ini_overrides:
  uwsgi:
    stats: "/tmp/octavia-api-uwsgi-stats.sock"

sahara_api_uwsgi_ini_overrides:
  uwsgi:
    stats: "/tmp/sahara-api-uwsgi-stats.sock"

ironic_api_uwsgi_ini_overrides:
  uwsgi:
    stats: "/tmp/ironic-api-uwsgi-stats.sock"

magnum_api_uwsgi_ini_overrides:
  uwsgi:
    stats: "/tmp/magnum-api-uwsgi-stats.sock"
Rerun all of the openstack-ansible playbooks to enable these stats. Use the ${service_name}-config tags on all of the os_* roles. It's possible to auto-generate the tags list with the following command.
openstack-ansible setup-openstack.yml --tags "$(cat setup-openstack.yml | grep -wo 'os-.*' | awk -F'-' '{print $2 "-config"}' | tr '\n' ',')"Optional | add Kafka Output format
To send data from Logstash to Kafka create the logstash_kafka_options variable. This variable will be used as a generator and create a Kafka output configuration file using the key/value pairs as options.
logstash_kafka_options:
  codec: json
  topic_id: "elk_kafka"
  ssl_key_password: "{{ logstash_kafka_ssl_key_password }}"
  ssl_keystore_password: "{{ logstash_kafka_ssl_keystore_password }}"
  ssl_keystore_location: "/var/lib/logstash/{{ logstash_kafka_ssl_keystore_location | basename }}"
  ssl_truststore_location: "/var/lib/logstash/{{ logstash_kafka_ssl_truststore_location | basename }}"
  ssl_truststore_password: "{{ logstash_kafka_ssl_truststore_password }}"
  bootstrap_servers:
    - server1.local:9092
    - server2.local:9092
    - server3.local:9092
  client_id: "elk_metrics_6x"
  compression_type: "gzip"
  security_protocol: "SSL"
  id: "UniqueOutputID"
For a complete list of all options available within the Logstash Kafka output plugin please review the following documentation.
- Optional config:
-
The following variables are optional and correspond to the example logstash_kafka_options variable.
logstash_kafka_ssl_key_password: "secrete"
logstash_kafka_ssl_keystore_password: "secrete"
logstash_kafka_ssl_truststore_password: "secrete"

# SSL certificates in Java KeyStore format
logstash_kafka_ssl_keystore_location: "/root/kafka/keystore.jks"
logstash_kafka_ssl_truststore_location: "/root/kafka/truststore.jks"
When using the kafka output plugin the options, logstash_kafka_ssl_keystore_location and logstash_kafka_ssl_truststore_location will automatically copy a local SSL key to the logstash nodes. These options are string value and assume the deployment nodes have local access to the files.
Optional | add Grafana visualizations
See the grafana directory for more information on how to deploy
grafana. When deploying grafana, source the variable file from ELK in
order to automatically connect grafana to the Elasticsearch datastore
and import dashboards. Including the variable file is as simple as
adding -e @../elk_metrics_6x/vars/variables.yml to the
grafana playbook run.
Included dashboards.
Example command using the embedded Ansible from within the grafana directory.
ansible-playbook ${USER_VARS} installGrafana.yml \
                              -e @../elk_metrics_6x/vars/variables.yml \
                              -e 'galera_root_user="root"' \
                              -e 'galera_address={{ internal_lb_vip_address }}'
Optional | add kibana custom dashboard
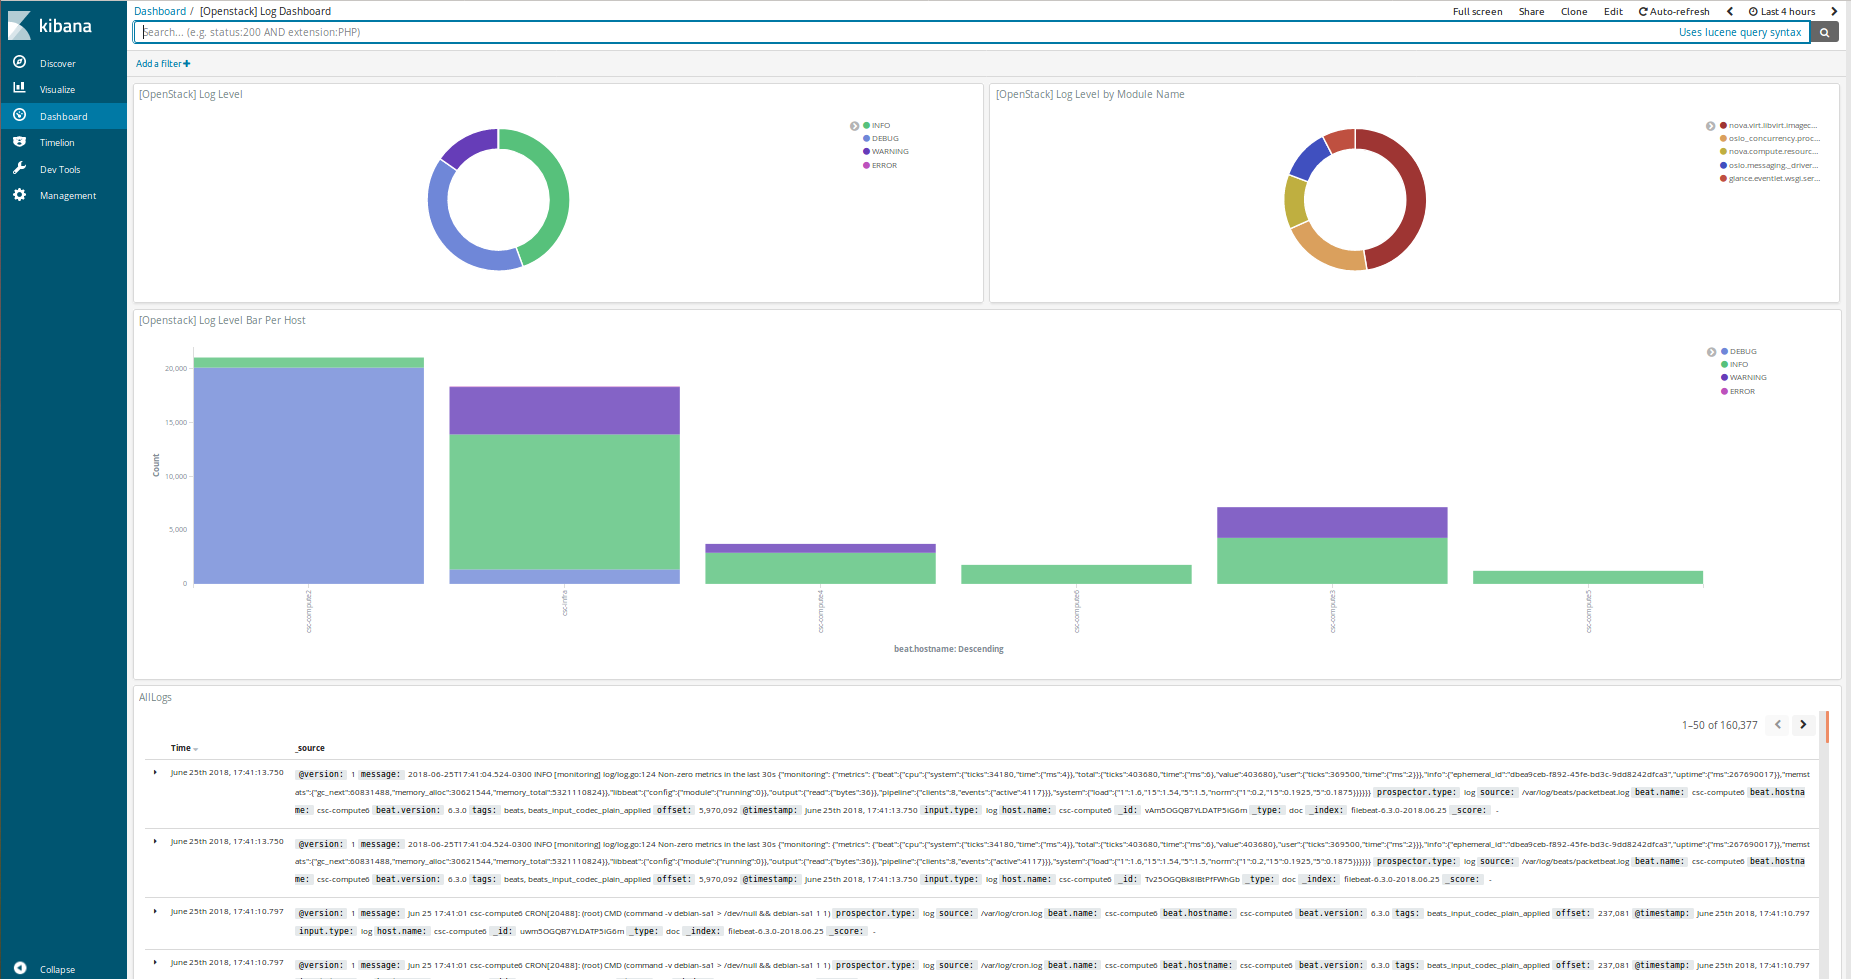
If you want to use a custom dashboard directly on your kibana, you can run the playbook below. The dashboard uses filebeat to collect the logs of your deployment.
ansible-playbook setupKibanaDashboard.yml $USER_VARSOverview of kibana custom dashboard
Optional | Customize Elasticsearch cluster configuration
Cluster configuration can be augmented using several variables which will force a node to use a given role.
Available roles are data, ingest, and master.
elasticsearch_node_data: This variable will override the automatic node determination and set a given node to be an "data" node.elasticsearch_node_ingest: This variable will override the automatic node-
determination and set a given node to be an "ingest" node.
elasticsearch_node_master: This variable will override the automatic node-
determination and set a given node to be an "master" node.
Example setting override options within inventory.
hosts:
  children:
    elastic-logstash:
      hosts:
        elk1:
          ansible_host: 10.0.0.1
          ansible_user: root
          elasticsearch_node_master: true
          elasticsearch_node_data: false
          elasticsearch_node_ingest: false
        elk2:
          ansible_host: 10.0.0.2
          ansible_user: root
          elasticsearch_node_master: false
          elasticsearch_node_data: true
          elasticsearch_node_ingest: false
        elk3:
          ansible_host: 10.0.0.3
          ansible_user: root
          elasticsearch_node_master: false
          elasticsearch_node_data: false
          elasticsearch_node_ingest: true
        elk4:
          ansible_host: 10.0.0.4
          ansible_user: root
With the following inventory settings elk1 would be a master node, elk2 would be a data, elk3 would be an ingest node, and elk4 would auto select a role.
Upgrading the cluster
To upgrade the packages throughout the elastic search cluster set the package state variable, elk_package_state, to latest.
cd /opt/openstack-ansible-ops/elk_metrics_6x
ansible-playbook site.yml $USER_VARS -e 'elk_package_state="latest"'
Forcing the Elasticsearch cluster retention policy to refresh
To force the cluster retention policy to refresh set elastic_retention_refresh, to "yes". When setting elastic_retention_refresh to "yes" the retention policy will forcibly be refresh across all hosts. This option should only be used when the Elasticsearch storage array is modified on an existing cluster. Should the Elasticseach cluster size change (nodes added or removed) the retention policy will automatically be refreshed on playbook execution.
cd /opt/openstack-ansible-ops/elk_metrics_6x
ansible-playbook site.yml $USER_VARS -e 'elastic_retention_refresh="yes"'
Troubleshooting
If everything goes bad, you can clean up with the following command
openstack-ansible /opt/openstack-ansible-ops/elk_metrics_6x/site.yml -e 'elk_package_state="absent"' --tags package_install
openstack-ansible /opt/openstack-ansible/playbooks/lxc-containers-destroy.yml --limit elk_all
Local testing
To test these playbooks within a local environment you will need a single server with at leasts 8GiB of RAM and 40GiB of storage on root. Running an m1.medium (openstack) flavor size is generally enough to get an environment online.
To run the local functional tests execute the run-tests.sh script out of the tests directory. This will create a 4 node elasticsearch cluster, 1 kibana node with an elasticsearch coordination process, and 1 APM node. The beats will be deployed to the environment as if this was a production installation.
CLUSTERED=yes tests/run-tests.shAfter the test build is completed the cluster will test it's layout and ensure processes are functioning normally. Logs for the cluster can be found at /tmp/elk-metrics-6x-logs.
To rerun the playbooks after a test build, source the tests/manual-test.rc file and follow the onscreen instructions.
To clean-up a test environment and start from a bare server slate the run-cleanup.sh script can be used. This script is destructive and will purge all elk_metrics_6x related services within the local test environment.
tests/run-cleanup.sh