2.7 KiB
Step 10. Profiling OpenStack Internals
Rally leverage OSprofiler to generate traces of OpenStack internal calls happening during the run of a scenario. Integration of OSProfiler in Rally can help to dig into concurrency problems of OpenStack which is a huge ecosystem of cooperative services.
Workflow
Enabling the profiler is based on a shared secret between the clients
(here Rally) and the various Openstack services : the HMAC key. In the
following we assume that your OpenStack services have been configured to
enable OSprofiler and that the secret HMAC key is
SECRET_KEY. This key is stored alongside the credentials of
your deployment. Once Rally is instructed about the HMAC key, a new
trace can be initialized for each iteration of the workload. Rally will
then store in its reports a profiler trace id. This id can be finally
used to query OSprofiler in order to get the full trace of the
iteration.
Registering the HMAC key
You can store your HMAC key in the environment variable
OSPROFILER_HMAC_KEY. This variable will be loaded if you
create your deployment with the --from-env option.
Alternatively if you create your deployment using the
--file option you can add the HMAC key with the following
:
{
  "openstack": {
    [...]
    "profiler_hmac_key": "SECRET_KEY"
  }
}
Getting the full trace
A trace id is stored on a per-iteration basis and can be found in the JSON report as-well as the HTML report :
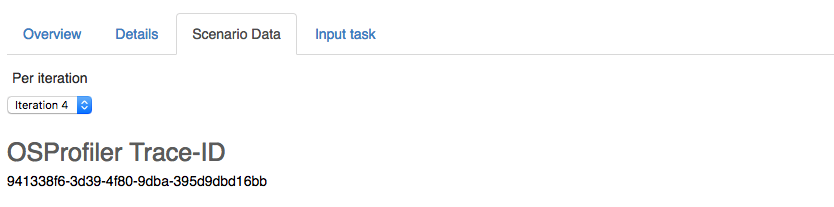
OSProfiler can be asked to generate the full trace using this trace id:
osprofiler trace show --html --out trace.html 941338f6-3d39-4f80-9dba-395d9dbd16bbDisabling the profiler
Setting enable_profiler = False under the
benchmark group in the configuration file will disabled the
profiler.