6.1 KiB
User Guide
Once the Ceilometer Redis plugin plugin has been installed (following Installation Guide), you can create OpenStack environments with Ceilometer whose Central agents, Notification agent and Alarm evaluator work in workload_partitioned mode.
Ceilometer installation
This plugin was created to provide partitioning for Ceilometer services. So its usage is senseless without Ceilometer installed. So, you will need to create a new OpenStack environment with Ceilometer using the Fuel UI Wizard.
Plugin configuration in MOS 8.0
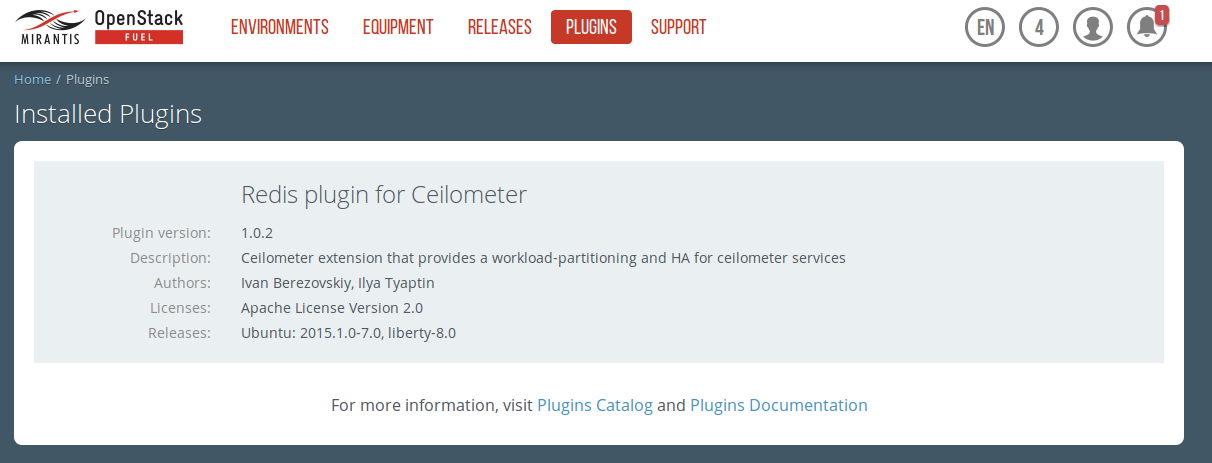
First of all, make sure that plugin was successfully installed. Go to the Plugins tab. You should see the following:
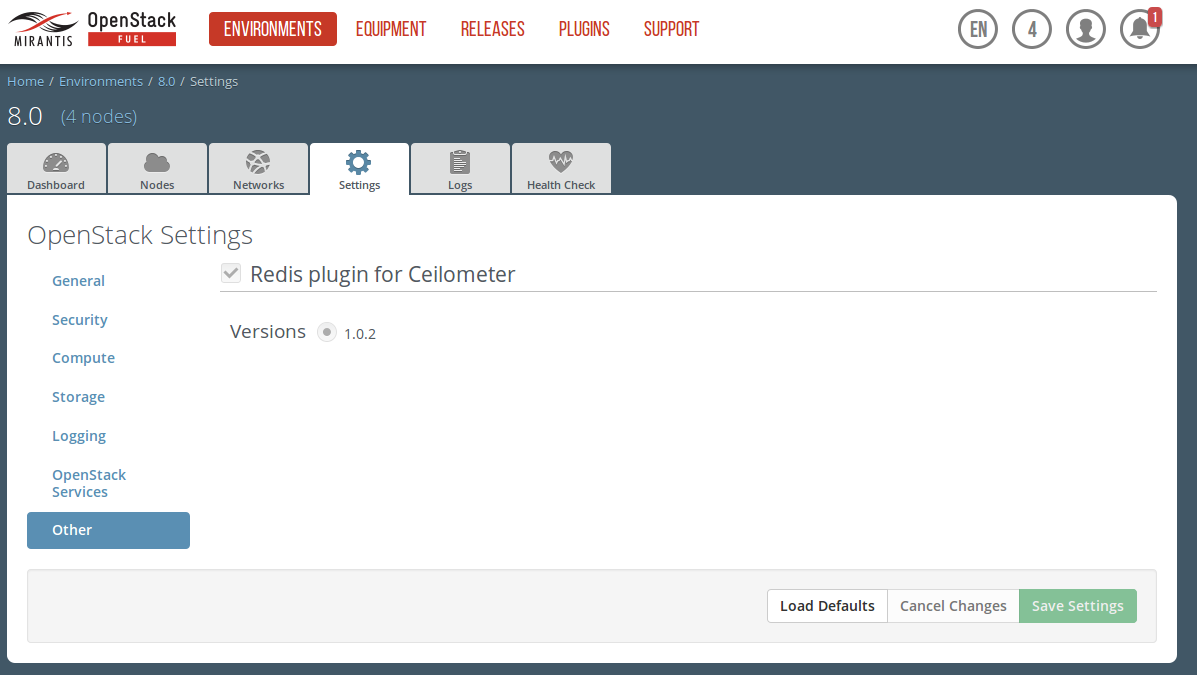
The next step is enable the plugin. Go to Environments tab and select the Redis plugin for Ceilometer checkbox:
When adding nodes to environment and assigning roles to them, please consider using odd number of controllers as mentioned in Limitations.
Finish environment configuration
Press "Deploy button" to once you are done with environment configuration.
Plugin configuration in MOS 7.0
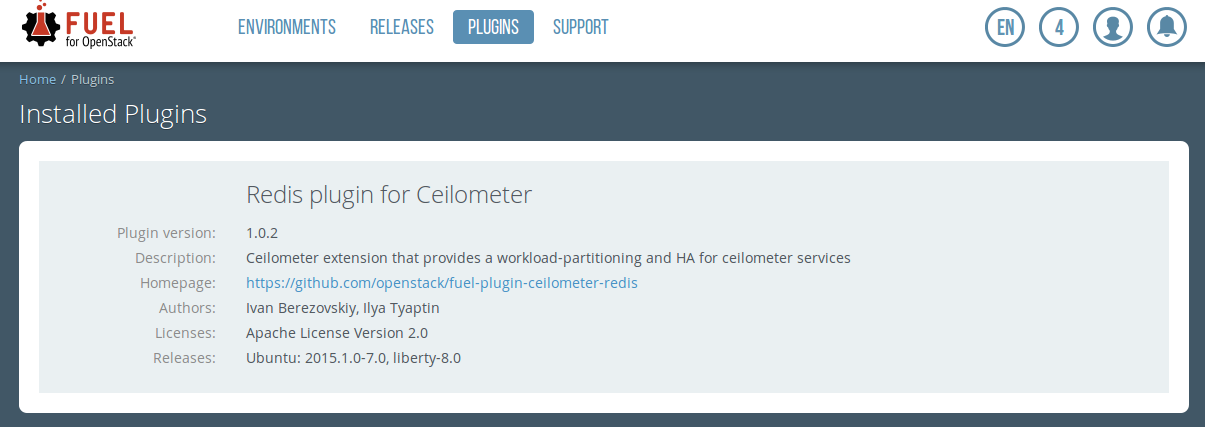
First of all, make sure that plugin was successfully installed. Go to the Plugins tab. You should see the following:
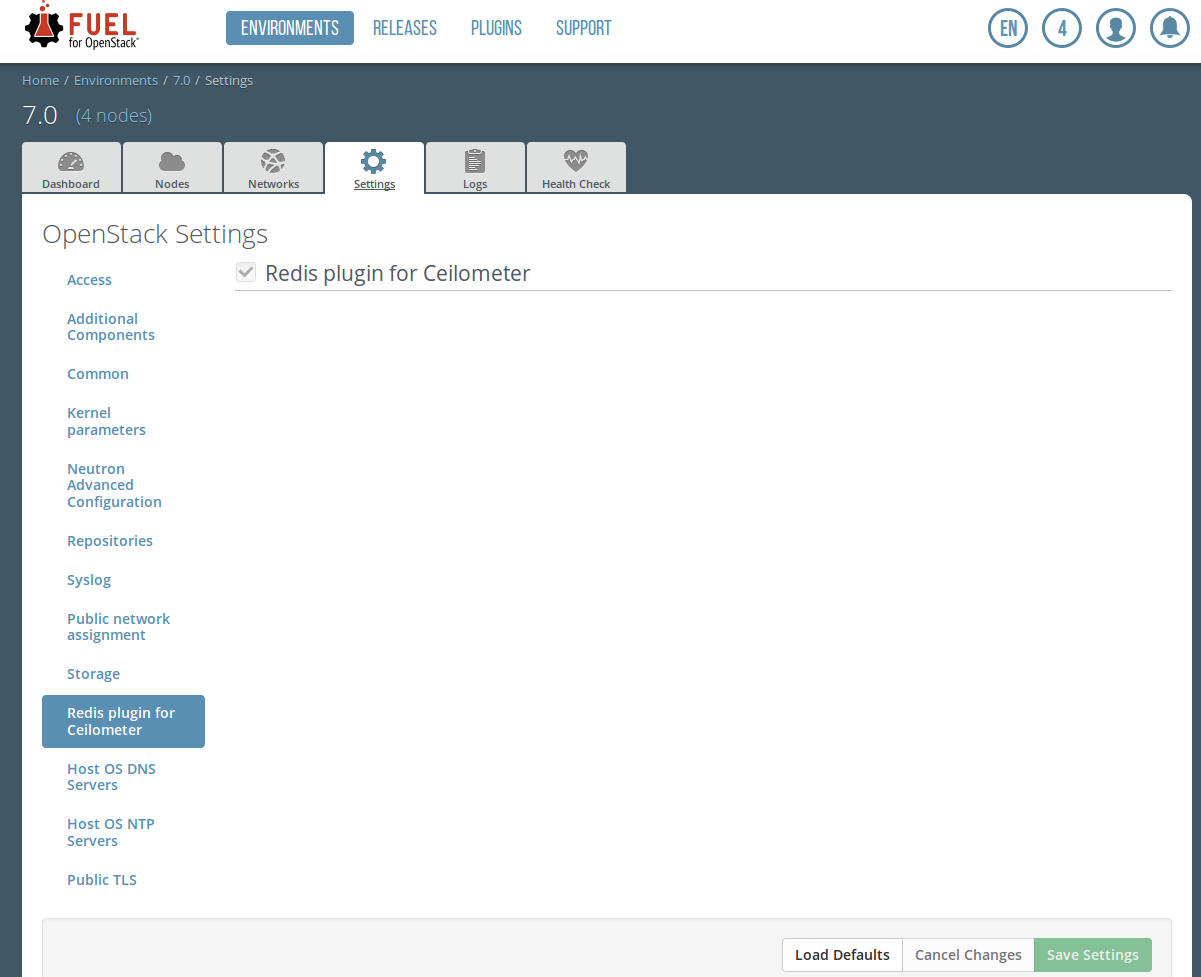
The next step is enable the plugin. Go to Environments tab and select the Redis plugin for Ceilometer checkbox:
When adding nodes to environment and assigning roles to them, please consider using odd number of controllers as mentioned in Limitations.
Finish environment configuration
Press Deploy button to once you are done with environment configuration.
How to check that plugin works
Check that ceilometer-agent-central and ceilometer-alarm-evaluator services are running on each controller. Run
pcs resourceand you should see the following in the output:Clone Set: clone_p_ceilometer-agent-central [p_ceilometer-agent-central] Started: [ node-21.domain.tld node-27.domain.tld node-33.domain.tld ] Clone Set: clone_p_ceilometer-alarm-evaluator [p_ceilometer-alarm-evaluator] Started: [ node-21.domain.tld node-27.domain.tld node-33.domain.tld ]Startedlist should contain all controllers.For the central agent: check that samples are not duplicated. For this purpose you may choose any metric collected by central agent. All these metrics may be found here Measurements . You may choose any section except OpenStack Compute and then select metric with 'Pollster' Origin. For example, let's choose storage.objects.
Plugin works correctly if you see one sample for each resource every polling_interval (1 minute in this example):
root@node-2:~# ceilometer sample-list -m storage.objects  -l 10| grep storage.objects
| 65e486c734394d3ea321ae72639ebe91 | storage.objects | gauge | 0.0    | object | 2015-11-05T10:32:27 |
| 65e486c734394d3ea321ae72639ebe91 | storage.objects | gauge | 0.0    | object | 2015-11-05T10:31:29 |
Plugin works incorrectly if there are duplications. In this example is seen that every
polling_intervalthere are 3 samples about one resource:root@node-2:~# ceilometer sample-list -m storage.objects -l 20| grep storage.objects | 65e486c734394d3ea321ae72639ebe91 | storage.objects | gauge | 0.0 | object ....| | 65e486c734394d3ea321ae72639ebe91 | storage.objects | gauge | 0.0 | object ....| | 65e486c734394d3ea321ae72639ebe91 | storage.objects | gauge | 0.0 | object ....| | 65e486c734394d3ea321ae72639ebe91 | storage.objects | gauge | 0.0 | object ....| | 65e486c734394d3ea321ae72639ebe91 | storage.objects | gauge | 0.0 | object ....| | 65e486c734394d3ea321ae72639ebe91 | storage.objects | gauge | 0.0 | object ....| .... 2015-11-05T10:27:37 | .... 2015-11-05T10:27:26 | .... 2015-11-05T10:27:17 | .... 2015-11-05T10:26:38 | .... 2015-11-05T10:26:26 | .... 2015-11-05T10:26:17 |- For the notification agent: Check that IPC queues are created and have consumers:
-
ubuntu@ubuntu:/opt/stack/ceilometer$ sudo rabbitmqctl list_queues name messages consumers | grep ceilo ceilometer-pipe-meter_source:meter_sink-0.sample 0 1 ceilometer-pipe-meter_source:meter_sink-1.sample 0 1 ceilometer-pipe-meter_source:meter_sink-2.sample 0 1 ceilometer-pipe-meter_source:meter_sink-3.sample 0 1 ceilometer-pipe-meter_source:meter_sink-4.sample 0 1
By default, you should see 10 queues in this list. Every queue should have one and only one consumer.
For the alarm evaluator, it is possible to see that everything works as expected only from the logs. Grep the line "extract_my_subset". There should be different "My subset: [" results on each alarm evaluator instance.