4.7 KiB
User Guide
Once the Ceilometer Redis Plugin is installed following the
instructions of the Installation Guide, you can create a Mirantis
OpenStack (MOS) environment with Ceilometer whose
ceilometer-agent-central and
ceilometer-alarm-evaluator services will work in
workload partitioned mode. This plugin was created to
enable the scale-out of these Ceilometer services. It is useless and
shouldn't be used if Ceilometer is not installed.
Plugin Configuration
To use the Ceilometer Redis Plugin, you need to create a new MOS environment with the Telemetry service (a.k.a Ceilometer) enabled and follow these steps using the Fuel UI Wizard.
Make sure that the plugin is properly installed on the Fuel Master node.
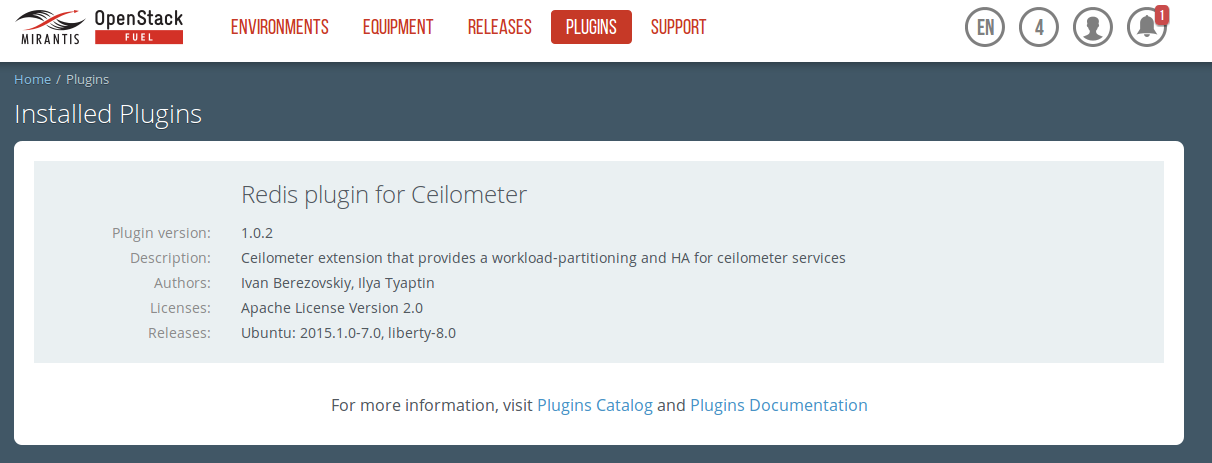
Go to the Plugins tab. You should see the following:
On Mos 8.0
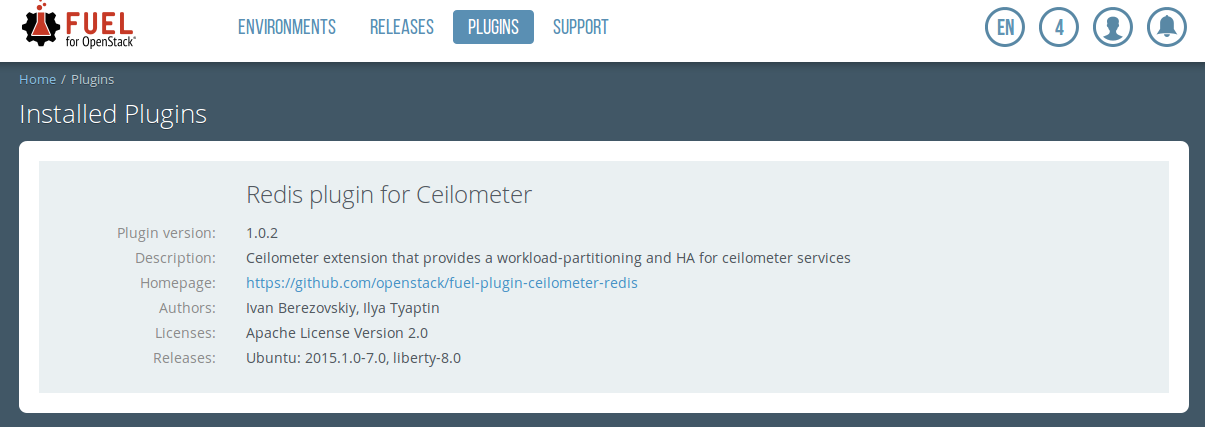
On Mos 7.0
Enable the plugin.
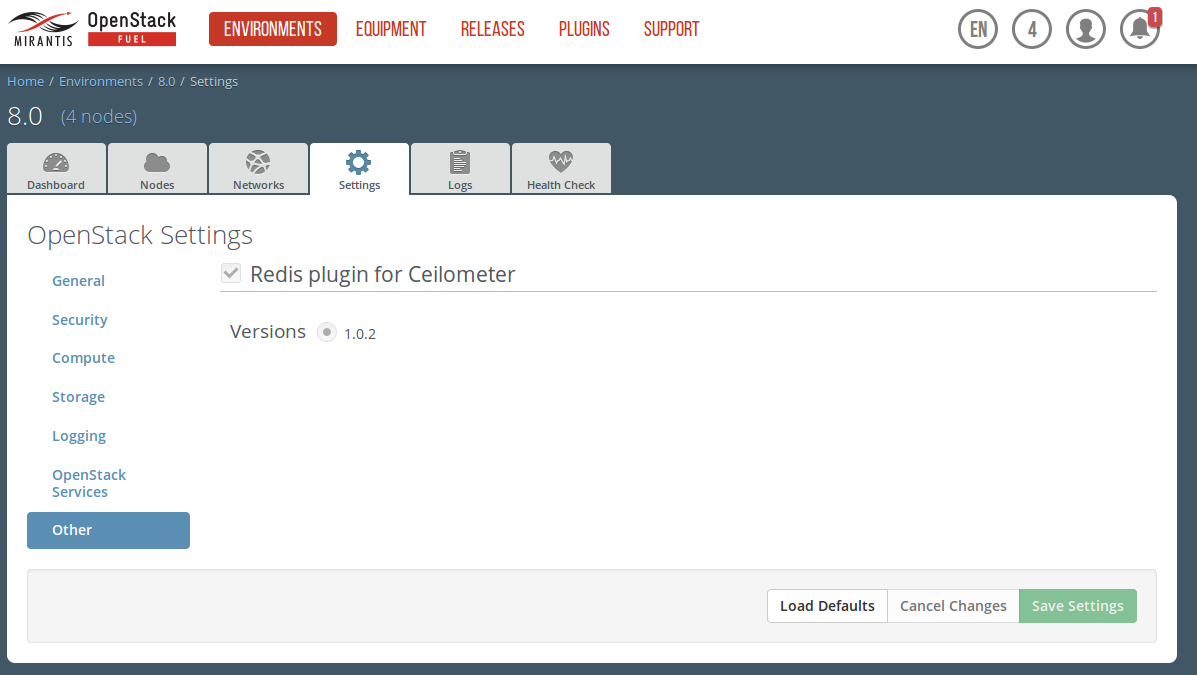
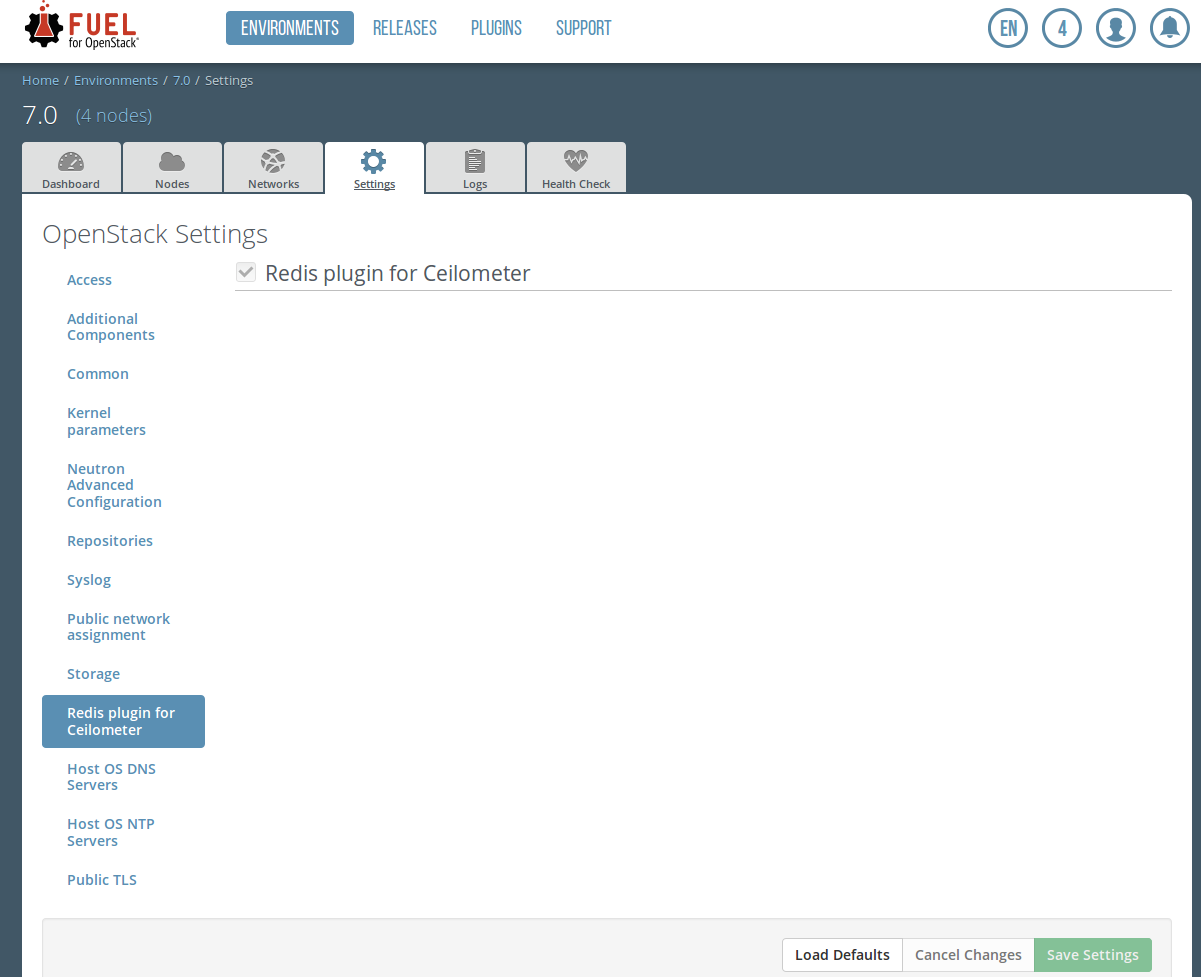
Go to the Environments tab and select the Redis plugin for Ceilometer checkbox:
On Mos 8.0
On Mos 7.0
Add nodes to your environment to which you will assign the controller role.
Note
When adding nodes to the environment and assign or change a role, do not forget to use an odd number of controllers as mentioned in
Limitationssection.
- Verify your network configuration.
- Deploy your changes once you are done with the configuration of your environment.
Plugin Verification
Check that the ceilometer-agent-central and ceilometer-alarm-evaluator services are running on each controller.
Run
pcs resource. You should see the following in the output:Clone Set: clone_p_ceilometer-agent-central [p_ceilometer-agent-central] Started: [ node-21.domain.tld node-27.domain.tld node-33.domain.tld ] Clone Set: clone_p_ceilometer-alarm-evaluator [p_ceilometer-alarm-evaluator] Started: [ node-21.domain.tld node-27.domain.tld node-33.domain.tld ]The Started list should contain all controllers.
For the ceilometer-agent-central, check that the samples are not duplicated. For this check you may choose any metric collected by the ceilometer-agent-central. All the Ceilometer metrics can be found in Measurements . You may choose any section excepted OpenStack Compute and then select a metric with Pollster Origin. For example, let's choose storage.objects.
The plugin works correctly if you see one sample for each resource type every polling interval (1 minute in this example):
root@node-2:~# ceilometer sample-list -m storage.objects  -l 10| grep storage.objects
| 65e486c7... | storage.objects | gauge | 0.0    | object | 2015-11-05T10:32:27 |
| 65e486c7... | storage.objects | gauge | 0.0    | object | 2015-11-05T10:31:29 |
The plugin works incorrectly if there are duplicates. In this example, the plugin works incorectly because there are three samples for the same resource type every polling interval:
root@node-2:~# ceilometer sample-list -m storage.objects  -l 20| grep storage.objects
| 65e486c7... | storage.objects | gauge | 0.0    | object | 2015-11-05T10:27:37 |
| 65e486c7... | storage.objects | gauge | 0.0    | object | 2015-11-05T10:27:26 |
| 65e486c7... | storage.objects | gauge | 0.0    | object | 2015-11-05T10:27:17 |
| 65e486c7... | storage.objects | gauge | 0.0    | object | 2015-11-05T10:26:38 |
| 65e486c7... | storage.objects | gauge | 0.0    | object | 2015-11-05T10:26:26 |
| 65e486c7... | storage.objects | gauge | 0.0    | object | 2015-11-05T10:26:17 |
For the alarm evaluator, it is possible to see that everything works as expected only from the logs:
# grep extract_my_subset /var/log/ceilometer/ceilometer-alarm-evaluator.logThere should be different My subset: [ results for the ceilometer-alarm-evaluator instances.