11 KiB
User Guide
Important preliminary notes
- It is highly recommended to do a network verification check prior to any deployment.
- This plugin version only supports Ubuntu OS type.
- You can also choose any supervisor and/or also change the networking configuration according to your needs but you can not use the old legacy networking mode (nova-network) as this is not supported.
- Please note however that the Zabbix server will be located on the controller nodes and that the MySQL database which Zabbix will use is common to all other OpenStack components. This might have a very important impact on CPU and/or memory usage on controller nodes as well as disk space consumption in /var/lib/mysql due to the fact that Zabbix is gathering quite an important number of metrics and quite frequently (see known problems hereafter).
- If you want Zabbix to operate in HA mode, you need to select several nodes as controllers so that the deployment automatically enables Zabbix high-availability.
Known problems
- If a base-os role node is deployed within the environment, the plugin installation may fail because the management network is not configured (see bug 1515956).
- If you remove some nodes after initial deployments, their related informations will not be removed from the Zabbix collected metrics and you will have to remove these manually from the Zabbix UI.
- MySQL database is common with other OpenStack services (see 1531834) This has a potential high impact on the disk sizing for /var/lib/mysql even though the biggest set of data has been cut down drastically.
- Zabbix server service is located on one of the controller nodes therefore and in the exact same manner than 1531834 can impact disk space, this can have a significant CPU and/or memory usage on controller nodes for large deployment.
- Error when deploying on MOS 9.0 env with modified hostnames (see bug 1633701).
Environment configuration
Create an environment.
For more information about environment creation, see Create a new OpenStack environment in Mirantis OpenStack User Guide.
Choose in Environments an environment for which you want to run Zabbix plugin.
Open Settings tab and scroll the page down. On the left select Zabbix for Fuel.
Set credentials for Zabbix for Fuel:
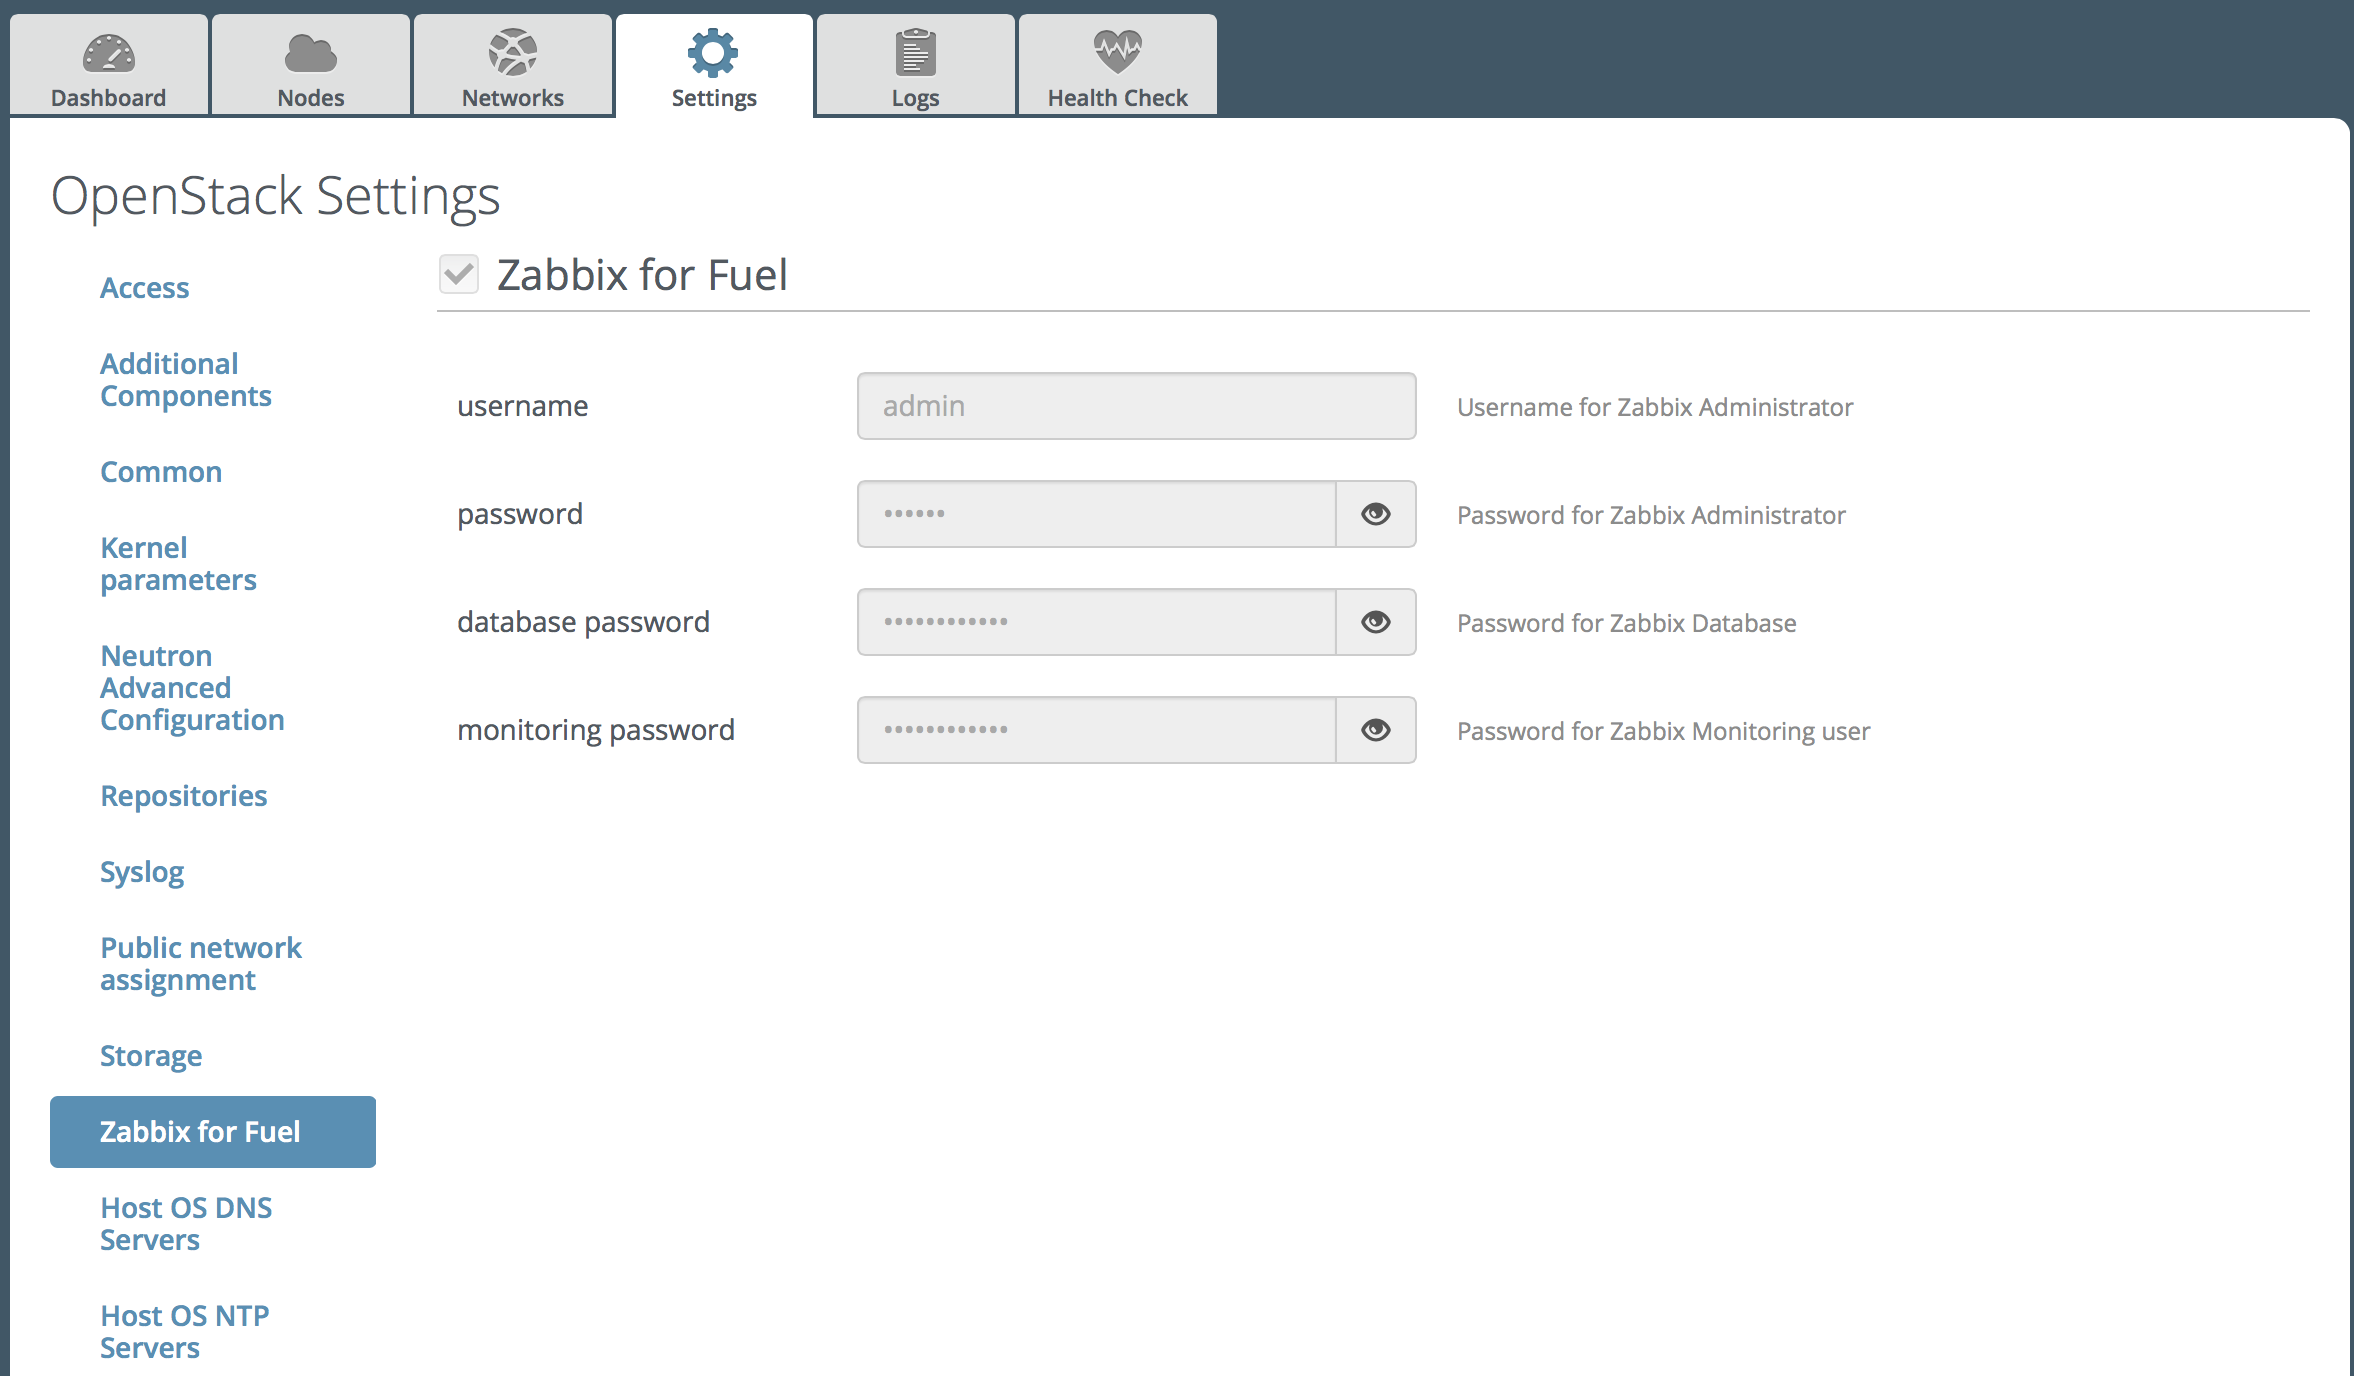
You could see default passwords by clicking on the eye icon.
It is highly recommended to change default passwords for Zabbix Administrator, Zabbix Database and Monitoring user.
User 'monitoring' will be added in Openstack for zabbix API checks.
Adjust other environment settings to your requirements and deploy the environment.
For more information, see Deploy changes in Mirantis OpenStack User Guide.
If you are using Fuel network-template you should add new roles mapping named 'zabbix'. Here is a sample:
network_scheme:
    mgmt:
        endpoints:
        - br-mgmt
        roles:
            zabbix: br-mgmt
For details see Using Networking Templates <https://docs.mirantis.com /openstack/fuel/fuel-7.0/operations.html#using-networking-templates>.
Zabbix frontend UI
After successful deployment you will see a green notification: “Deployment of environment 'test' is done. Access the OpenStack dashboard (Horizon) at http://172.16.0.2/”.
In this example, 172.16.0.2 is a VIP address (see troubleshooting section to see how to get this IP address).
Zabbix UI will be available at http://172.16.0.2/zabbix (at
http://<VIP>/zabbixin general).After opening this address in a browser, you should see Zabbix login page:
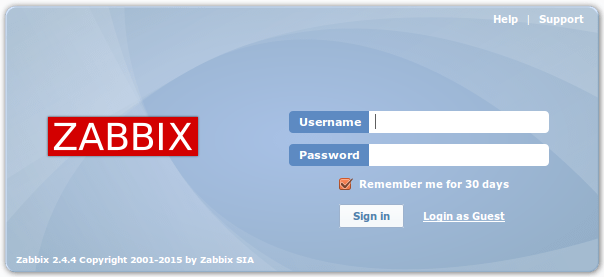
Now log into Zabbix with the credentials set provided on the Settings tab of the Fuel web UI (see step 2 in the Environment configuration section).
After logging into Zabbix, you will see the Zabbix Dashboard page:
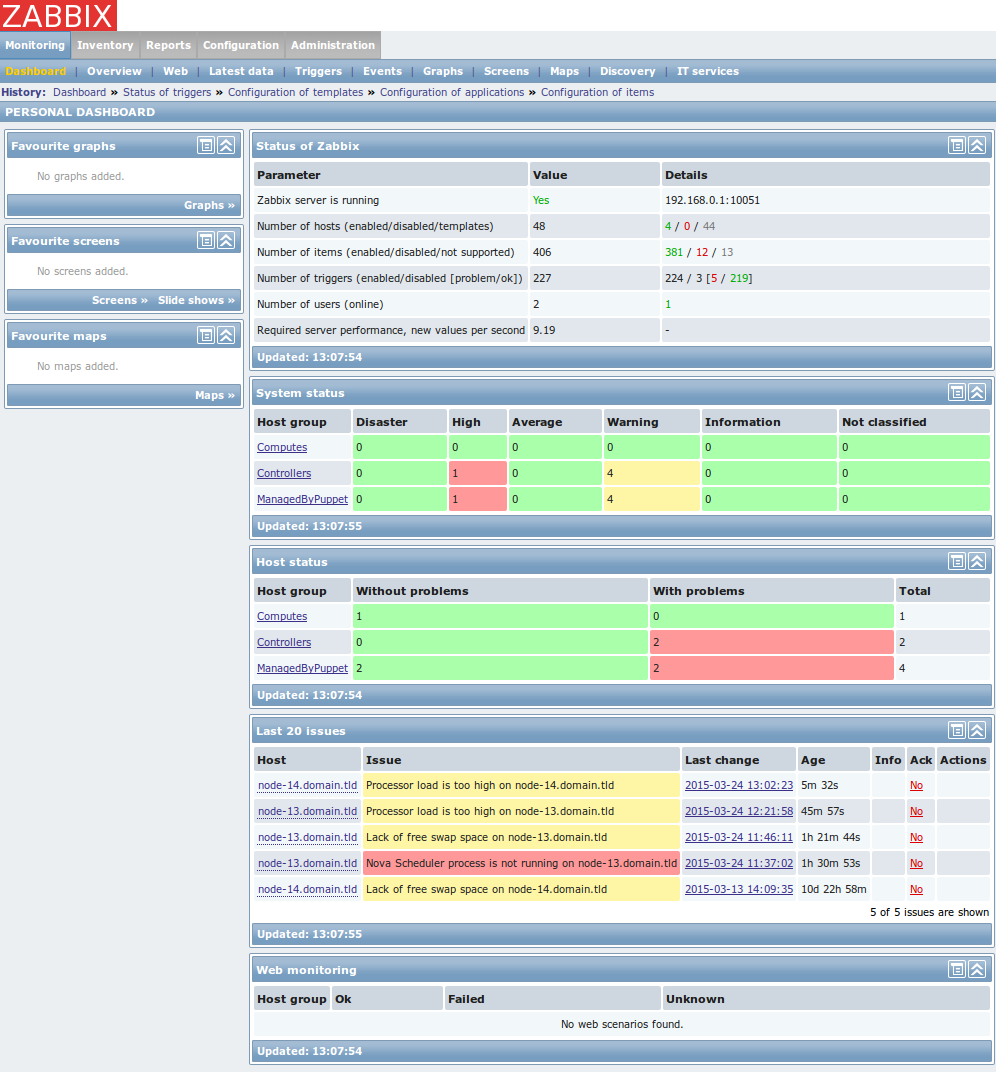
The Zabbix Dashboard page provides information on running processes and their state.
If all processes are running successfully in the environment, you should see only green color.
To demonstrate that monitoring is working properly, the Nova Scheduler process had been turned off.
You can notice that Zabbix detected the halted process and provided the problem description: Nova Scheduler process is not running on node-13.domain.tld.
When you go to Monitoring->Screens page, you will see the OpenStack Cluster screen:
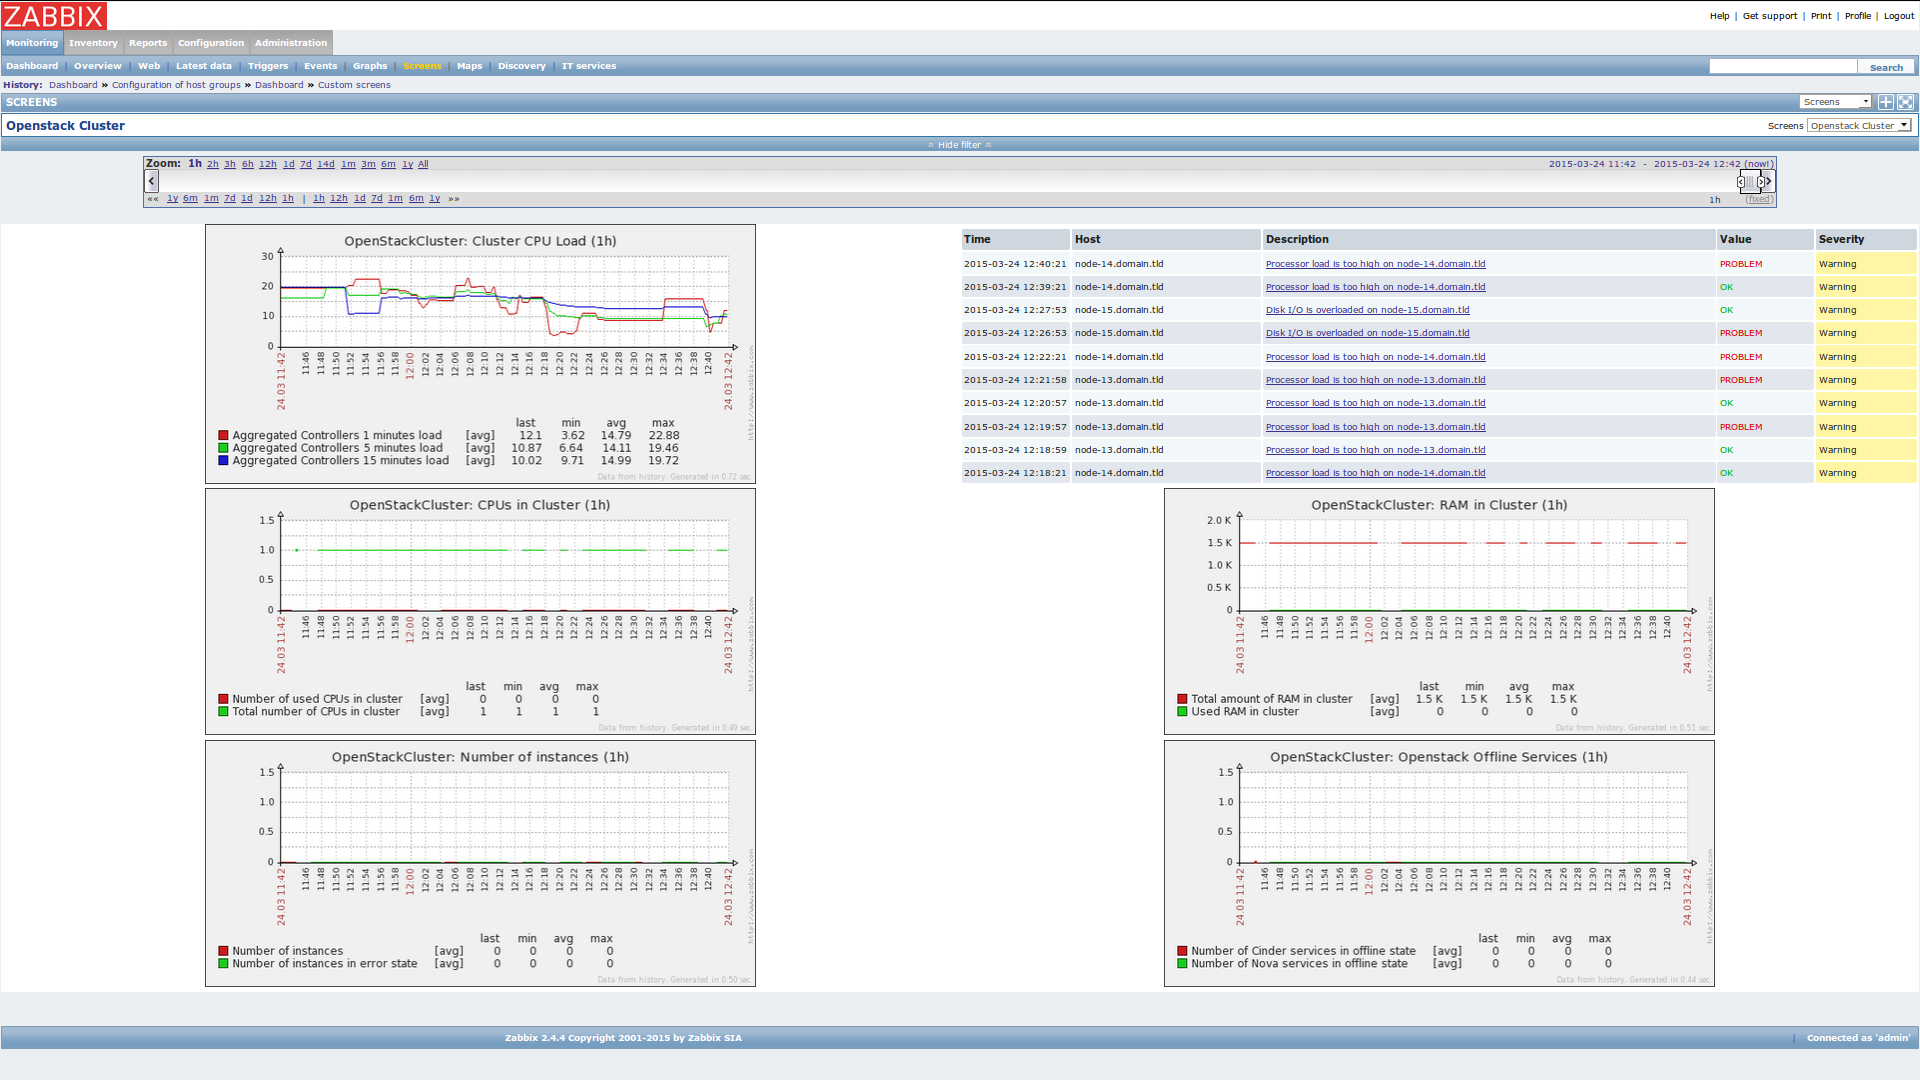
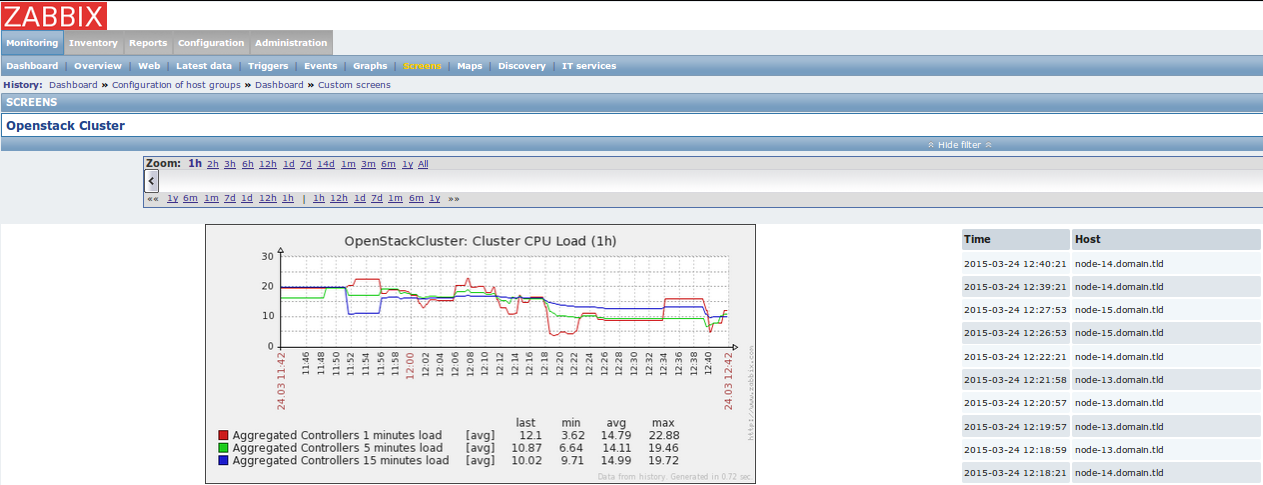
On this screen you have general statistics and graphs presenting resources usage in OpenStack environment.
There is also a list of last 10 events recorded by Zabbix.
Pages
Below there are a few screenshots from Zabbix configuration pages to show how it should look after a successful environment deployment. Zabbix UI provides several pages placed under Configuration tab.
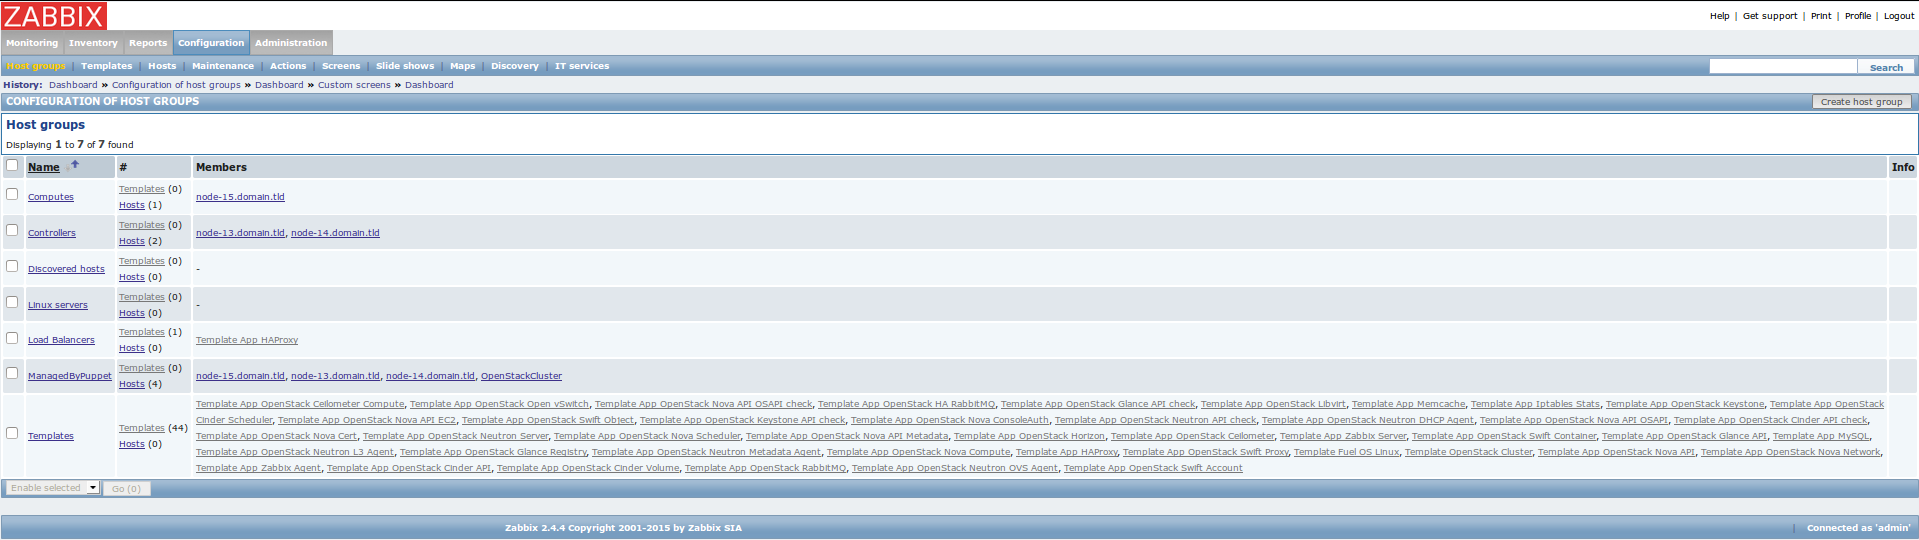
Host groups page
This page has a list of host groups with their members. There are separate groups for Controllers and Computes. These groups are used to join nodes with the same role in OpenStack environment. There is also ManagedByPuppet group which contains all OpenStack nodes. Remaining host groups are created by default in Zabbix. For more information and instructions, see 6.1 Hosts and host groups <https://www.zabbix.com/documentation/2.4/manual/config /hosts> chapter in the official Zabbix Documentation.
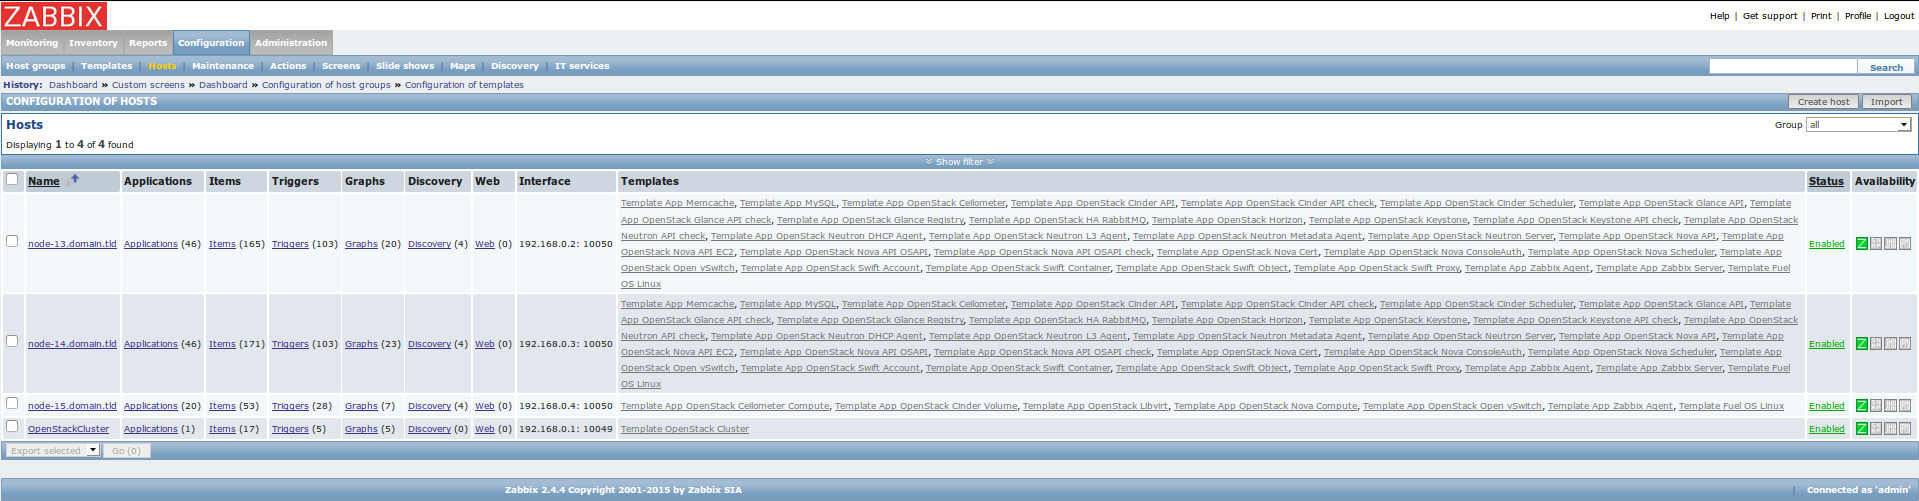
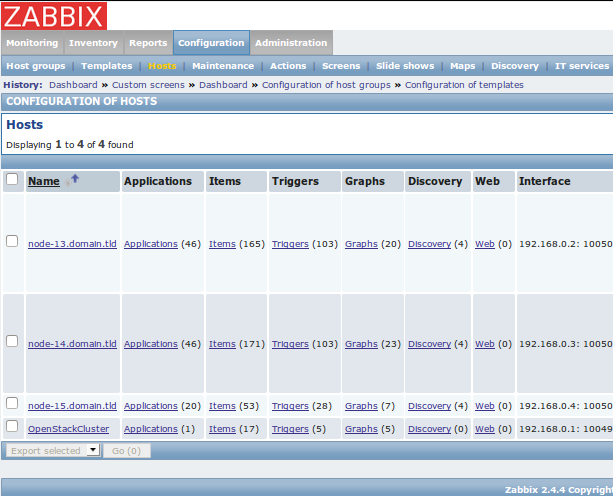
Hosts page
This page contains a list of all monitored OpenStack nodes and, additionally one OpenStackCluster virtual host which represents OpenStack API. There are also lists of linked monitoring templates to particular hosts. During installation, the plugin detects which services have been installed on a particular node and links appropriate templates to the node to enable monitoring for those services. There is an Zabbix agent availability report in the last column. When ‘Z’ icon is green, the Zabbix agent on this node is running and available.
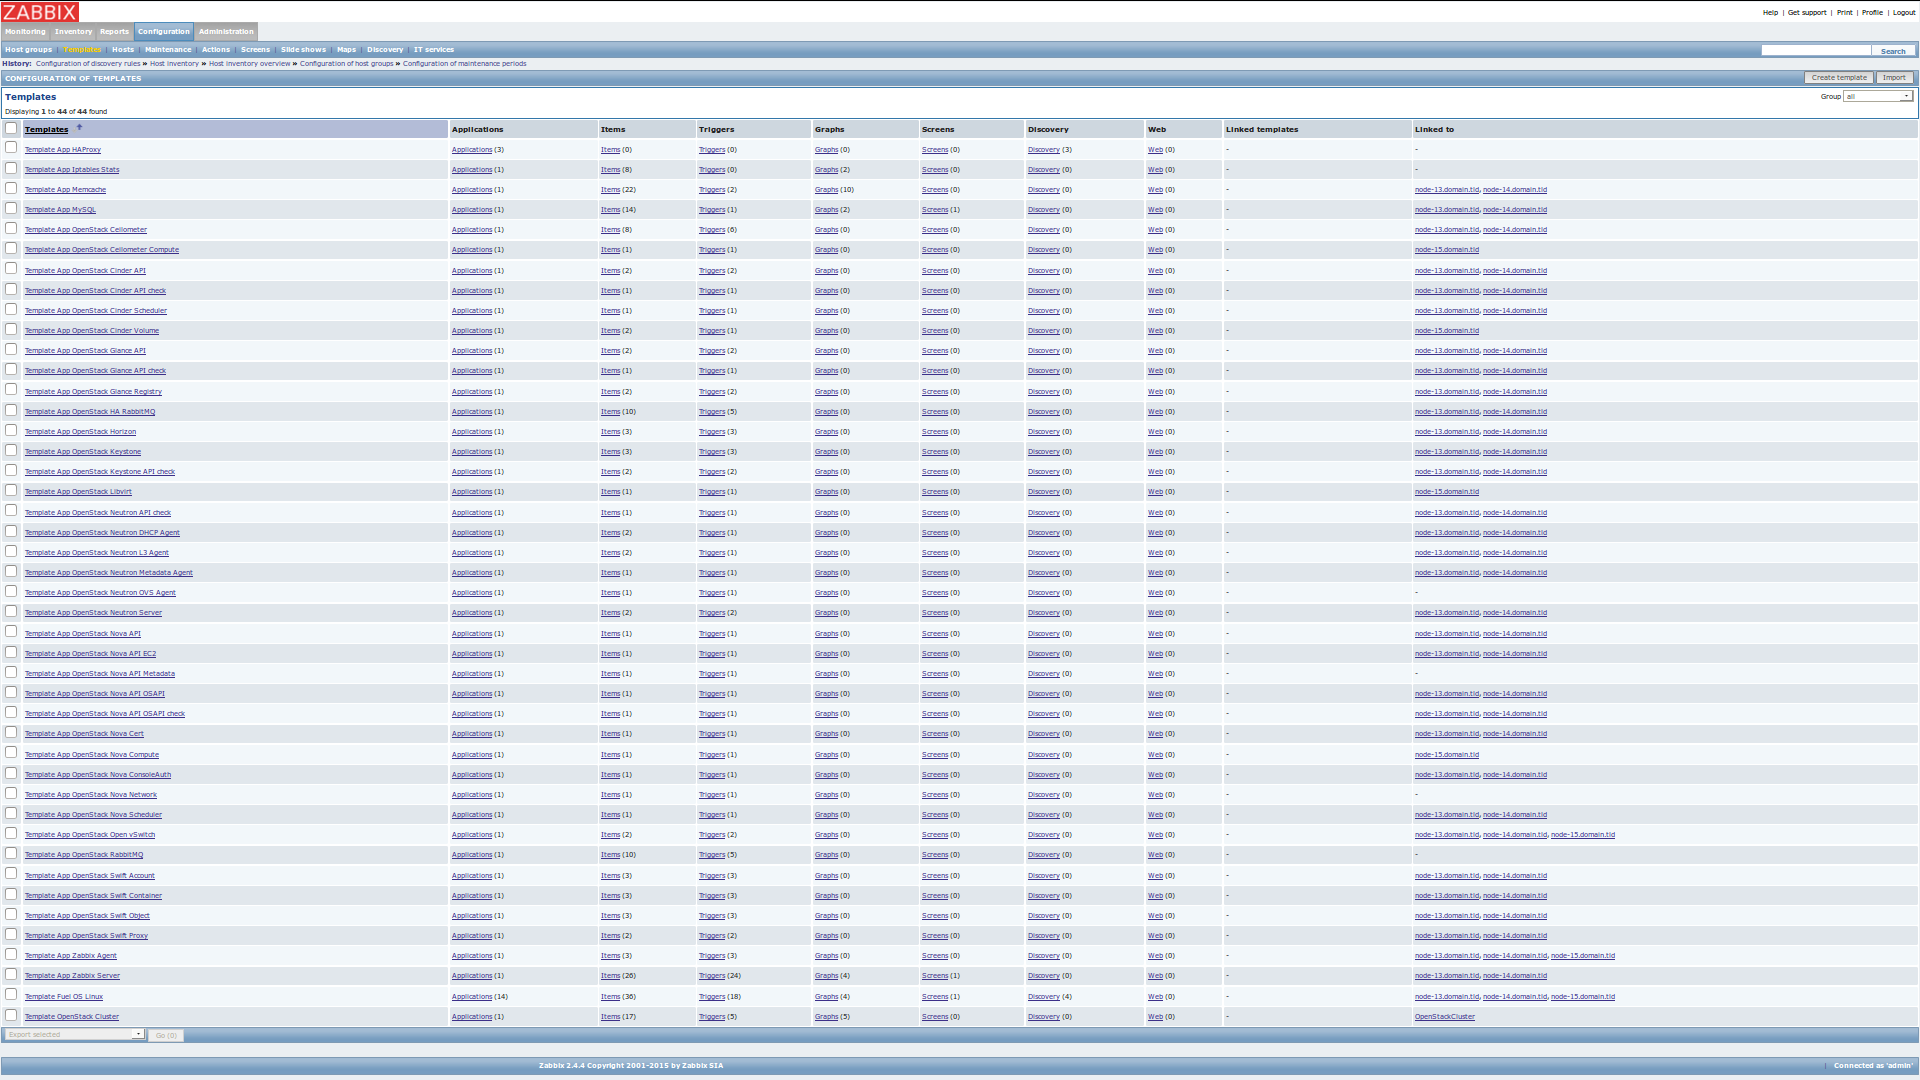
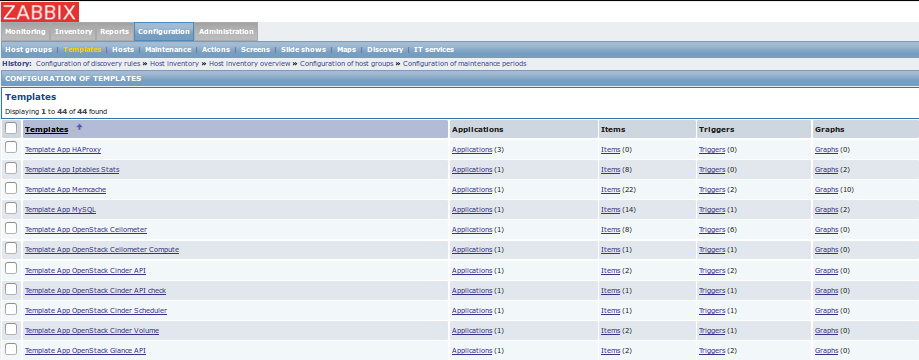
Templates page
This page contains a list of all monitoring templates and list of hosts to which they are linked. A monitoring template is a way to group items, graphs and thresholds which monitor a particular resource type, for example an OpenStack service like Nova Compute. For more information and instructions, see 6.6 Templates chapter <https://www.zabbix.com/documentation/2.4/manual /config/templates> in the official Zabbix Documentation.
You can add an additional items (checks), create triggers and events via Zabbix UI. For more information and instructions, see 6.2 Items, 6.3 Triggers and 6.4 Events chapters <https://www.zabbix.com/documentation/2.4/manual /config/events> in the official Zabbix Documentation.
By default, there are no notifications configured, but you can add them into the Zabbix UI. For more information and instructions, see 6.7 Notifications upon events chapter in the official Zabbix Documentation.
Ceph
When Ceph is deployed the plugin configures:
A check on the general health of the cluster as reported by the command ceph health (version 1.0.0)
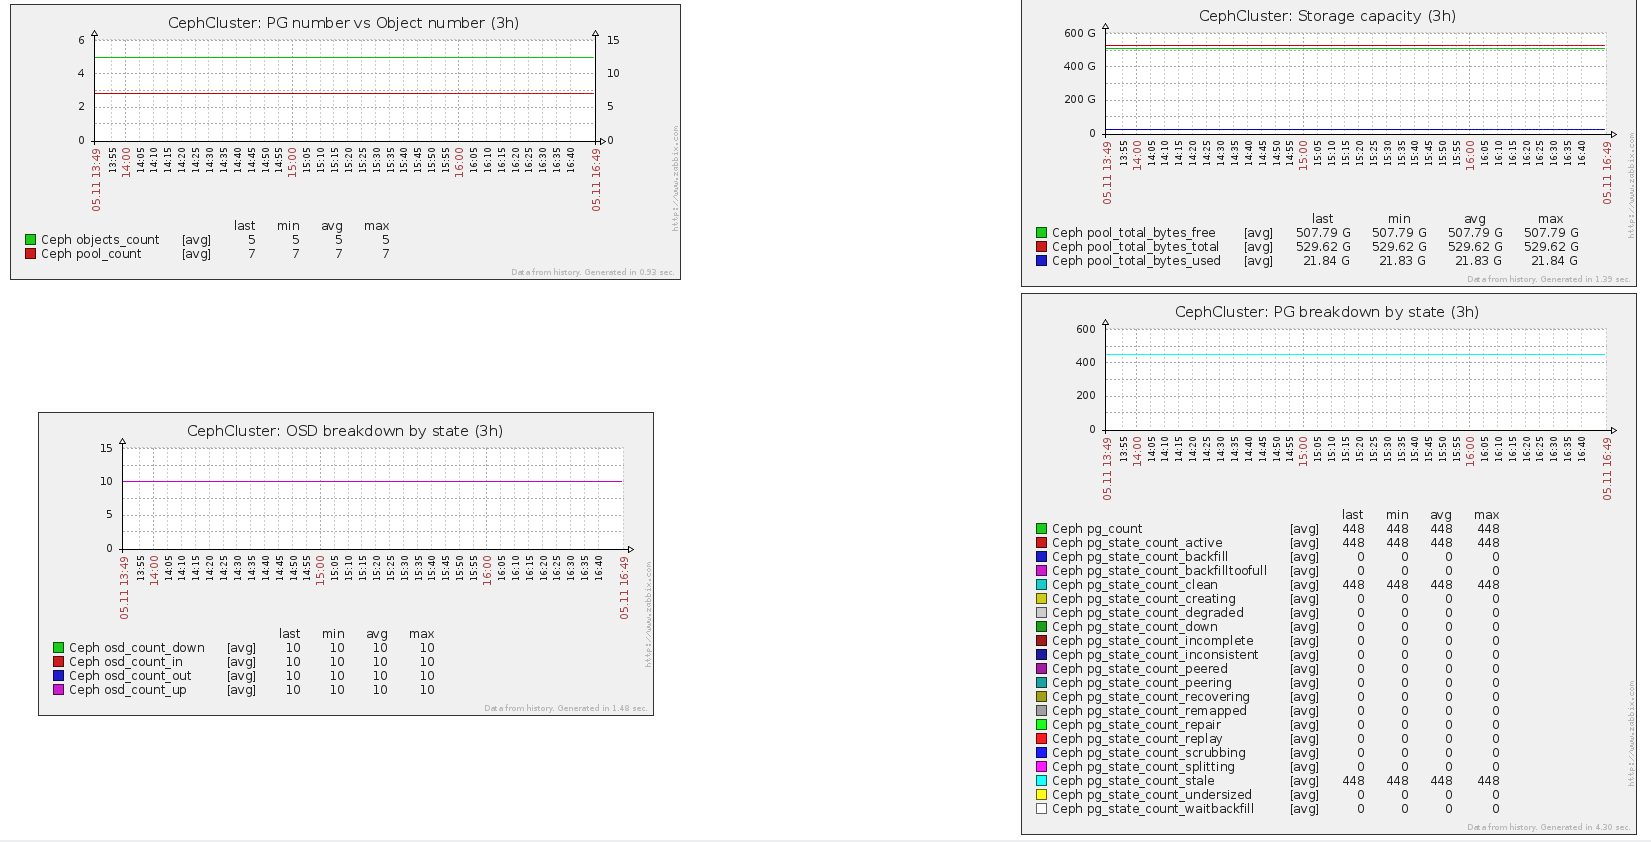
A Screen 'Ceph' providing an overview of the cluster with the following metrics (version 2.5.0):
Zabbix is configured to verify that all Ceph processes are running (version 2.5.0):
- ceph-osd
- ceph-mon (on controller nodes)
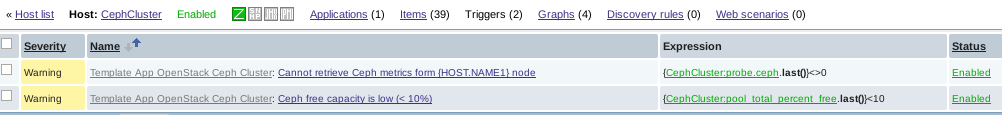
A Host 'CephCluster' is configured where are attached all cluster metrics (version 2.5.0):
- Metrics collected for the cluster (version 2.5.0):
- monitor_count
- quorum_count
- pg_bytes_used
- pg_bytes_free
- pg_bytes_total
- pg_data_bytes
- pg_count
- pg_state_count_backfill
- pg_state_count_repair
- pg_state_count_creating
- pg_state_count_recovering
- pg_state_count_peered
- pg_state_count_incomplete
- pg_state_count_peering
- pg_state_count_splitting
- pg_state_count_waitbackfill
- pg_state_count_down
- pg_state_count_backfilltoofull
- pg_state_count_remapped
- pg_state_count_replay
- pg_state_count_inconsistent
- pg_state_count_clean
- pg_state_count_active
- pg_state_count_undersized
- pg_state_count_degraded
- pg_state_count_stale
- pg_state_count_scrubbing
- objects_count
- pool_count
- pool_total_bytes_used
- pool_total_bytes_free
- pool_total_bytes_total
- pool_total_percent_used
- pool_total_percent_free
- osd_count_up
- osd_count_down
- osd_count_in
- osd_count_out
- Triggers configured (version 2.5.0):
- An alert is triggered when Zabbix fail to collect Ceph cluster metrics
- An alert is triggered when the cluster free capacity is under 10%
MySQL
The following metrics are retrieved for each MySQL server (generally running on controller nodes):
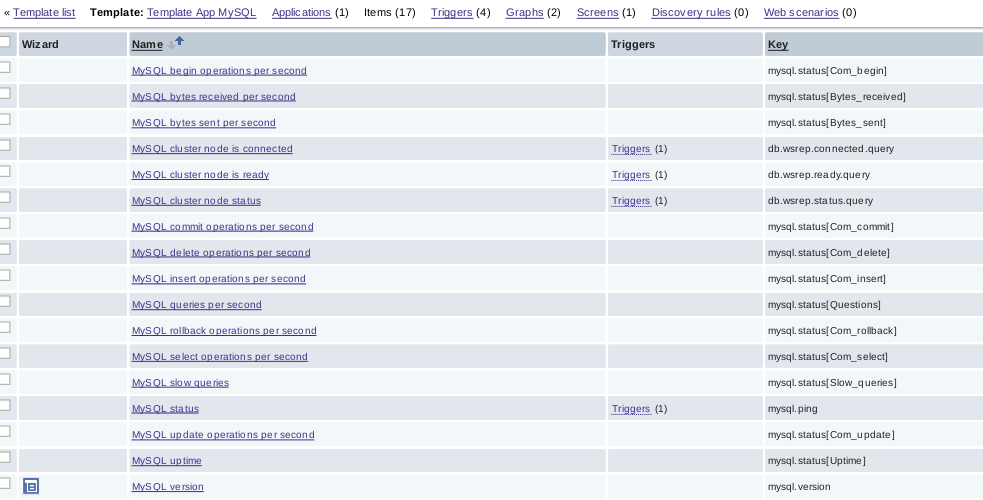
and 4 triggers are configured:
- a simple mysqladmin ping check (version 1.0.0)
- and 3 cluster related checks (version 2.5.0):
- the cluster node is ready
- the cluster node is connected to the cluster
- the cluster node status (Primary, Non-Primary or Disconnected)