This commit was bulk generated and pushed by the OpenDev sysadmins as a part of the Git hosting and code review systems migration detailed in these mailing list posts: http://lists.openstack.org/pipermail/openstack-discuss/2019-March/003603.html http://lists.openstack.org/pipermail/openstack-discuss/2019-April/004920.html Attempts have been made to correct repository namespaces and hostnames based on simple pattern matching, but it's possible some were updated incorrectly or missed entirely. Please reach out to us via the contact information listed at https://opendev.org/ with any questions you may have. |
||
|---|---|---|
| contrib/dashboards | ||
| deployment_scripts/puppet | ||
| figures | ||
| repositories | ||
| specs | ||
| .gitreview | ||
| environment_config.yaml | ||
| functions.sh | ||
| LICENSE | ||
| metadata.yaml | ||
| pre_build_hook | ||
| README.md | ||
| tasks.yaml | ||
InfluxDB-Grafana Plugin for Fuel
InfluxDB-Grafana plugin
Overview
InfluxDB provides an open source time series database. Grafana is a rich dashboard and graph editor for InfluxDB.
Requirements
| Requirement | Version/Comment |
|---|---|
| Mirantis OpenStack compatibility | 6.1 or higher |
Recommendations
None.
Limitations
None.
Installation Guide
InfluxDB-Grafana plugin installation
To install the InfluxDB-Grafana plugin, follow these steps:
-
Download the plugin from the Fuel Plugins Catalog.
-
Copy the plugin file to the Fuel Master node. Follow the Quick start guide if you don't have a running Fuel Master node yet.
scp influxdb_grafana-0.8-0.8.0-0.noarch.rpm root@<the Fuel Master node IP address>: -
Install the plugin using the
fuelcommand line:fuel plugins --install influxdb_grafana-0.8-0.8.0-0.noarch.rpm -
Verify that the plugin is installed correctly:
fuel plugins
Please refer to the Fuel Plugins wiki if you want to build the plugin by yourself, version 2.0.0 (or higher) of the Fuel Plugin Builder is required.
User Guide
InfluxDB-Grafana plugin configuration
- Create a new environment with the Fuel UI wizard.
- Add a node with the "Operating System" role.
- Before applying changes or once changes applied, edit the name of the node by clicking on "Untitled (xx:yy)" and modify it for "influxdb".
- Click on the Settings tab of the Fuel web UI.
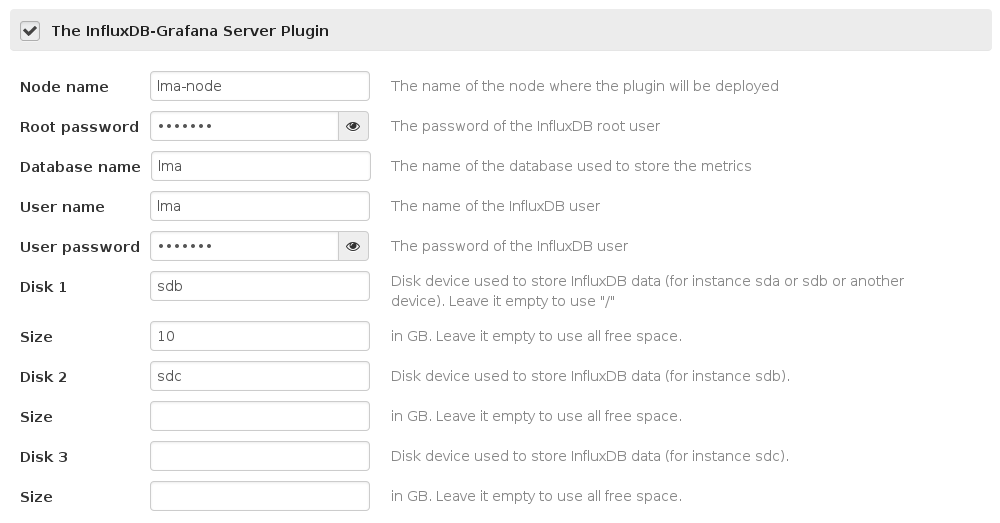
- Scroll down the page, select the "InfluxDB-Grafana Server plugin" checkbox
and fill-in the required fields.
- The name of the node where the plugin is deployed.
- The password for the InfluxDB root user.
- The name of the database where you want to store your metrics.
- The username and the password for this specific database.
- The name and the password for the Grafana admin user.
You can select up to 3 physical disks that will be mounted as a single logical volume to store the InfluxDB data. If you specify no disk, the data will be stored on the root filesystem. In all cases, InfluxDB data will be located in the /opt/influxdb directory.
For each disk, you can also specify the allocated size (in GB). If you don't specify a value, the plugin will use all the free space of the disk.
Here is a screenshot of the fields
Testing
InfluxDB
Once installed, you can check that InfluxDB is working using curl:
curl -G 'http://<HOST>:8086/'  \
  --data-urlencode "u=<root user of InfluxDB>" \
  --data-urlencode "p=<password of root user>" \
  --data-urlencode "q=show databases"
Where HOST is the IP address or the name of the node that runs the server and
credentials are those provided in the Fuel UI for the InfluxDB root user.
The curl command should return something similar to:
{"results":[{"series":[{"name":"databases","columns":["name"],"values":[["lma"]]}]}]}
Grafana
Grafana is available at:
http://$HOST:8000/
You can login by using the username and password that you provided in the Fuel UI.
Known issues
None.
Release Notes
0.8.0
- Upgrade Grafana to 2.1
- Upgrade InfluxDB to 0.9
0.7.0
- Initial release of the plugin. This is a beta version.
Development
The OpenStack Development Mailing List is the preferred way to communicate,
emails should be sent to openstack-dev@lists.openstack.org with the subject
prefixed by [fuel][plugins][lma].
Reporting Bugs
Bugs should be filled on the Launchpad fuel-plugins project (not GitHub) with the tag lma.
Contributing
If you would like to contribute to the development of this Fuel plugin you must follow the OpenStack development workflow.
Patch reviews take place on the OpenStack gerrit system.
Contributors
- Guillaume Thouvenin gthouvenin@mirantis.com
- Simon Pasquier spasquier@mirantis.com
- Swann Croiset scroiset@mirantis.com
