4.0 KiB
Required reports and outputs for defcore
Blueprint: https://blueprints.launchpad.net/refstack/+spec/define-tools-for-defcore Storyboard: https://storyboard.openstack.org/#!/story/109
Refstack data is used by the DefCore committee to identify capabilities and tests to include in the OpenStack core. To facilitate this process, refstack should produce and present / display this information to the committee in a meaningful way.
We anticipate that these reports will also be interesting to the broader OpenStack community to select popular capabilities; consequently, the results should not be focused strictly on DefCore as the consumer.
A detailed description of the problem:
The DefCore report needs to show both core and non-core tests. While the underlying data is the same (% of population reporting pass), we must clearly show a difference between core and non-core tests. We must _not make non-core and non-pass results appear negative. It is very important that data be presented without adding negative bias.
Since the target is interoperability, the community will expect the reports to highlight core tests that are below a specific threshold (assumed 50% for now) as at risk and non-core tests that are above a specific threshold (assumed 80% for now) as likely candidates for core tests. The report should highlight both types of tests clearly
Note: The reports must work well for the color blind reader.
Design Approach:
The report will be grouped into capabilities with the % pass for each test within the capability shown as a pie chart. By stacking the pies close together for each capability, the report becomes an effective "stacked bar" without losing the per test detail.
Core tests should have their passing rate shown in green. If the rate is <50% then a thicker red border should be added.
Non-Core tests should have their passing rate shown in black. If the rate is >80% then a thicker green border should be added.
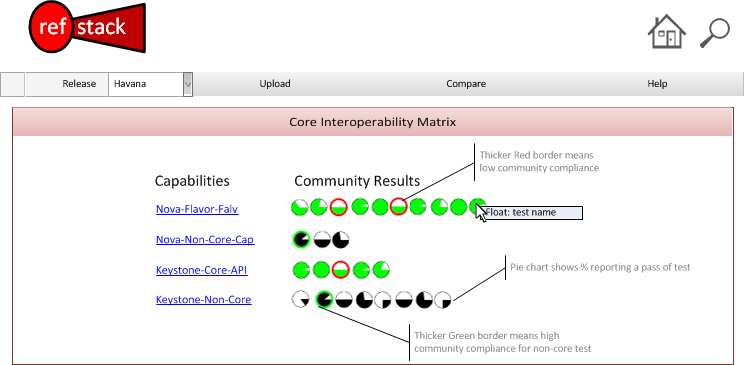
The intention of this design is to make it very easy to find outliers in the overall result. A quick scan of the results should easily find tests or groups of tests that have high or low compliance in the community. The report is designed to focus on pass rates rather than on fail/skip rates.
The data driving the UI should also be available as JSON data using an API on the same URL path. It may be possible to implement the UI client side using the API without server rendering. This implementation choice is left to the developer.
Alternatives
It would be possible to supply only JSON data via the API; however, this will not help the community evaluate interoperability and is less desirable.
Data model impact
Likely none; however, depending on the complexity of the queries, it may be necessary to create intermediate tables to collect the results.
If new models are needed, this spec should be updated with the design. At this time, we assume that the collection does not require an intermediate model.
Specification for the method
These are read-only reports and should use GETs.
The URL path should match the other UI paths with then following pattern:
HTML response: GET /[refstack base]/defcore/[release] JSON response: GET /[refstack base]/defcore/[release].json
Security impact
Since these these reports are based on public data and interoperability is a community need, the reports should be non-restricted in the UI. They should not require any login to view.
Notifications impact:
None.
Other end user impact:
Added navigation on UI.
Developer impact
None.
Assignee(s)
TBD
Work Items
- Spec * Mock
- CSS & HTML Frame
- Data Collection
- Connect Data into UI Page
Dependencies
Sparklines JS libraries: http://omnipotent.net/jquery.sparkline/#s-about
Documentation Impact
Need to document screen and meaning of fields.
References