the docs are a bit wordy in some places. our docs are confusing
enough:

- remove notification > polling in architecture page
- remove redundant Events filtering from event_types
- move shuffle/batch options to customisation page
- add http publisher
- remove db choices from architecture page, point to dbreco page
- remove db background referencing single database route
- remove warnings to say db might change, use api (obvious)
- remove stuff about Ceilometer is part Openstack but not tied to it
- move hbase configuration under common hbase section in install
- remove tox compatibility comments since it's > 2 years
- remove random non-devstack/historical text from devstack page
- remove default cinder/nova configurations from devstack page

Change-Id: Ifdbeee358cfcb5d3736608e39067ff2859cc0ed6
8.8 KiB
System Architecture
single: agent; architecture double: compute agent; architecture double: collector; architecture double: data store; architecture double: database; architecture double: API; architecture
High-Level Architecture
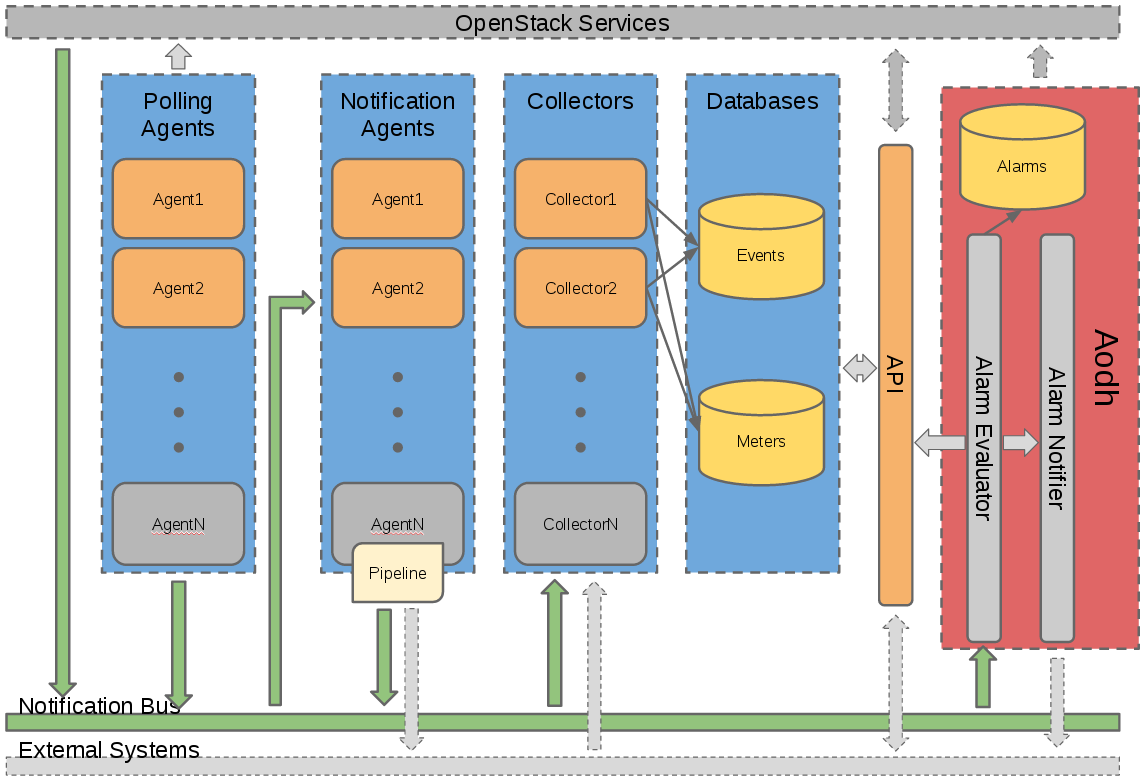
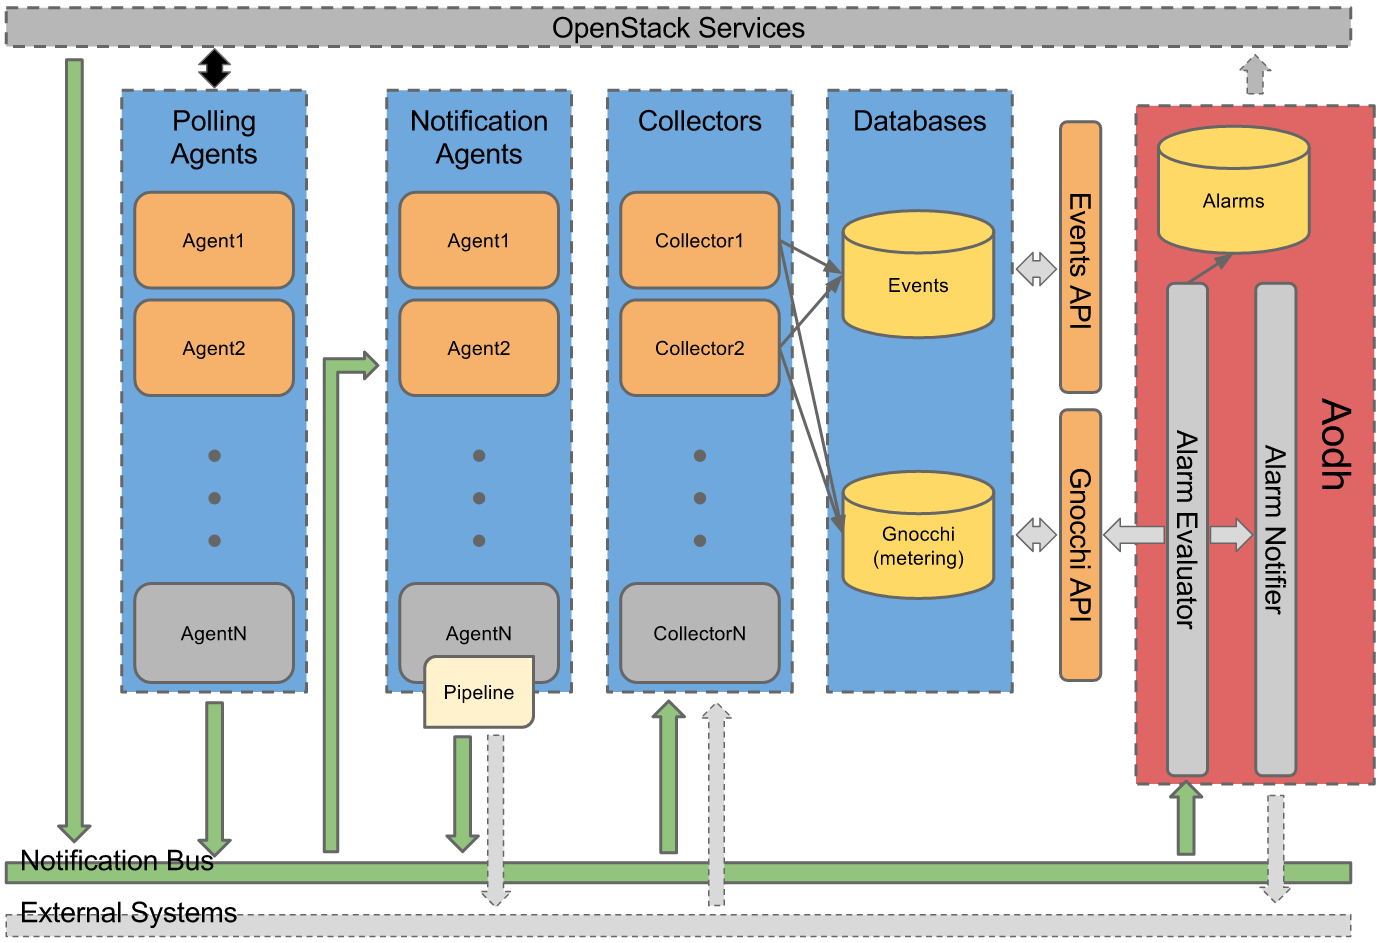
Each of Ceilometer's services are designed to scale horizontally. Additional workers and nodes can be added depending on the expected load. Ceilometer offers three core services, the data agents designed to work independently from collection, but also designed to work together as a complete solution:
- polling agent - daemon designed to poll OpenStack services and build Meters.
- notification agent - daemon designed to listen to notifications on message queue, convert them to Events and Samples, and apply pipeline actions.
- (optional) collector - daemon designed to gather and record event and metering data created by notification and polling agents (if using Gnocchi or full-fidelity storage).
- (optional) api - service to query and view data recorded by collector in internal full-fidelity database (if enabled).
As Ceilometer has grown to capture more data, it became apparent that data storage would need to be optimised. To address this, Gnocchi (resource metering as a service) was developed to capture the data in a time series database to optimise storage and querying. Gnocchi is intended to replace the existing metering database interface.
Gathering the data
How is data collected?
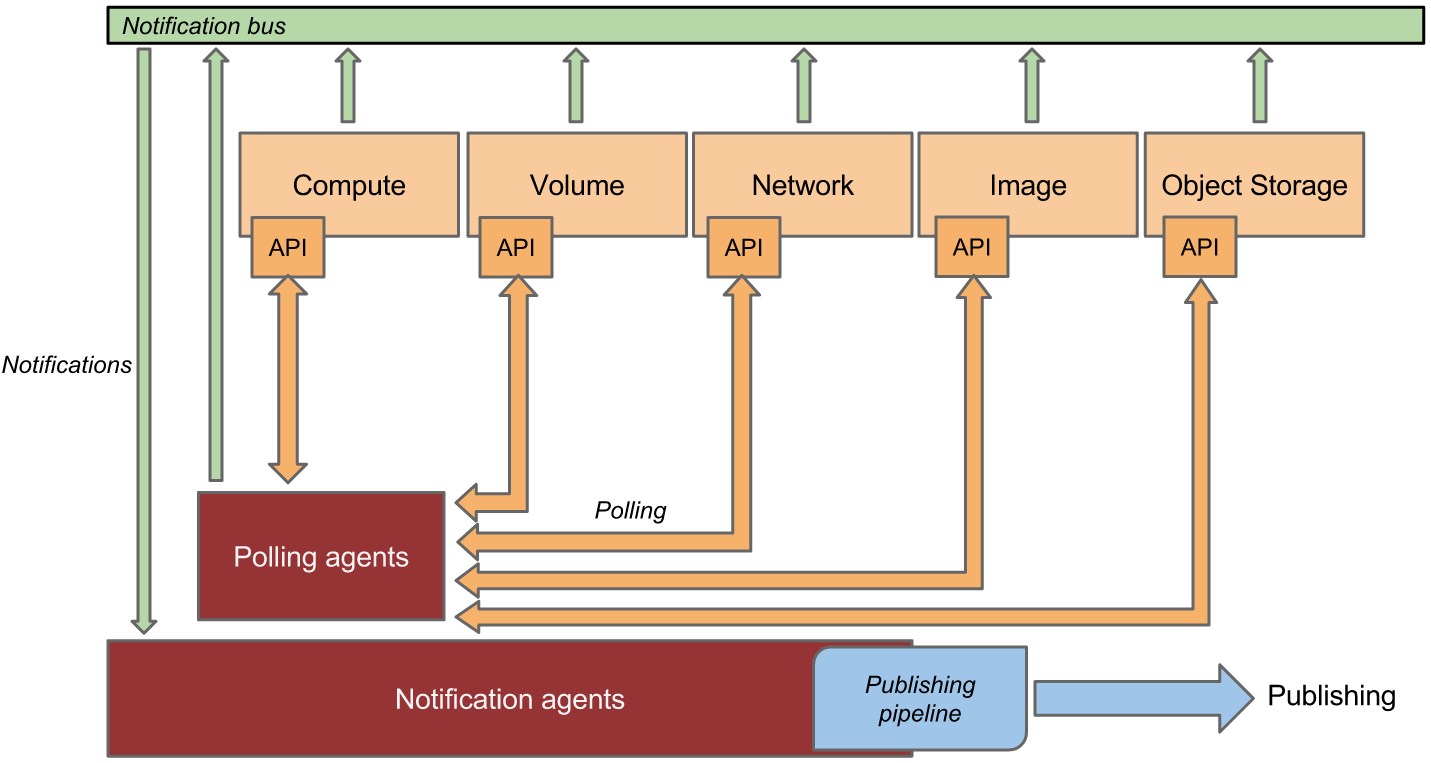
The Ceilometer project created 2 methods to collect data:
Bus listener agentwhich takes events generated on the notification bus and transforms them into Ceilometer samples. This is the preferred method of data collection. If you are working on some OpenStack related project and are using the Oslo library, you are kindly invited to come and talk to one of the project members to learn how you could quickly add instrumentation for your project.Polling agents, which is the less preferred method, will poll some API or other tool to collect information at a regular interval. The polling approach is less preferred due to the load it can impose on the API services.
The first method is supported by the ceilometer-notification agent, which monitors the message queues for notifications. Polling agents can be configured either to poll the local hypervisor or remote APIs (public REST APIs exposed by services and host-level SNMP/IPMI daemons).
Notification Agents: Listening for data
double: notifications; architecture

The heart of the system is the notification daemon (agent-notification) which monitors the message bus for data being provided by other OpenStack components such as Nova, Glance, Cinder, Neutron, Swift, Keystone, and Heat, as well as Ceilometer internal communication.
The notification daemon loads one or more listener plugins,
using the namespace ceilometer.notification. Each plugin
can listen to any topics, but by default it will listen to
notifications.info. The listeners grab messages off the
defined topics and redistributes them to the appropriate
plugins(endpoints) to be processed into Events and Samples.
Sample-oriented plugins provide a method to list the event types
they're interested in and a callback for processing messages
accordingly. The registered name of the callback is used to enable or
disable it using the pipeline of the notification daemon. The incoming
messages are filtered based on their event type value before being
passed to the callback so the plugin only receives events it has
expressed an interest in seeing. For example, a callback asking for
compute.instance.create.end events under
ceilometer.compute.notifications would be invoked for those
notification events on the nova exchange using the
notifications.info topic. Event matching can also work
using wildcards e.g. compute.instance.*.
Polling Agents: Asking for data
double: polling; architecture
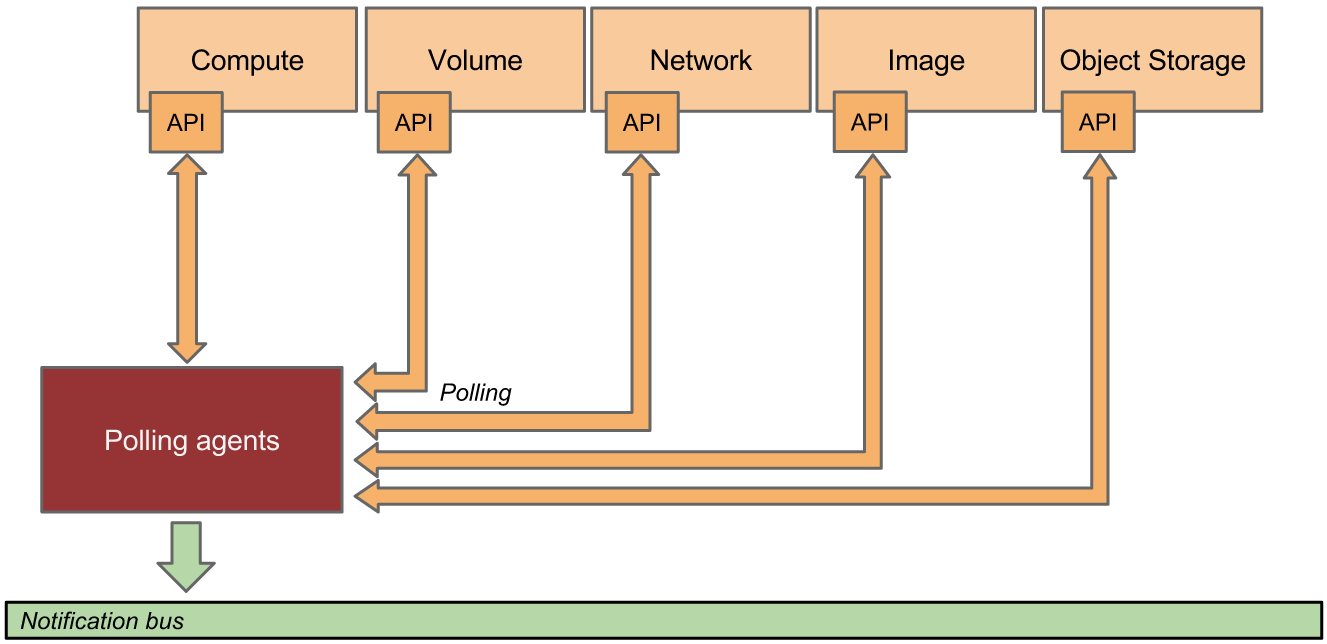
Polling for compute resources is handled by a polling agent running
on the compute node (where communication with the hypervisor is more
efficient), often referred to as the compute-agent. Polling via service
APIs for non-compute resources is handled by an agent running on a cloud
controller node, often referred to the central-agent. A single agent can
fulfill both roles in an all-in-one deployment. Conversely, multiple
instances of an agent may be deployed, in which case the workload is
shared. The polling agent daemon is configured to run one or more
pollster plugins using either the
ceilometer.poll.compute and/or
ceilometer.poll.central namespaces.
The agents periodically ask each pollster for instances of
Sample objects. The frequency of polling is controlled via
the pipeline configuration. See Pipeline-Configuration for details. The agent
framework then passes the samples to the notification agent for
processing.
Processing the data
Pipeline Manager
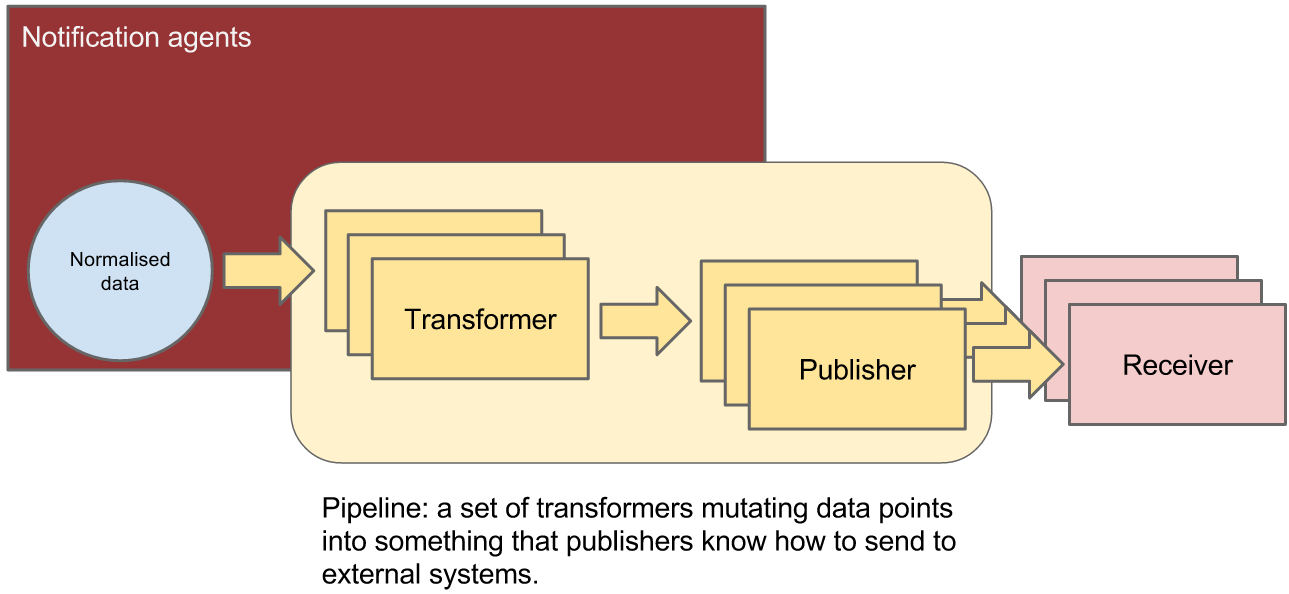
Ceilometer offers the ability to take data gathered by the agents, manipulate it, and publish it in various combinations via multiple pipelines. This functionality is handled by the notification agents.
Transforming the data
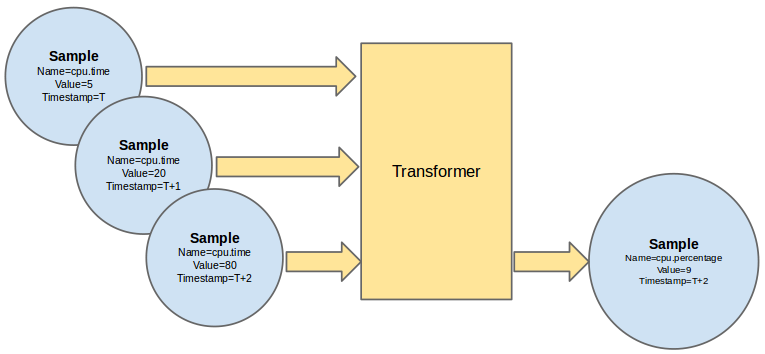
The data gathered from the polling and notifications agents contains a wealth of data and if combined with historical or temporal context, can be used to derive even more data. Ceilometer offers various transformers which can be used to manipulate data in the pipeline.
Publishing the data
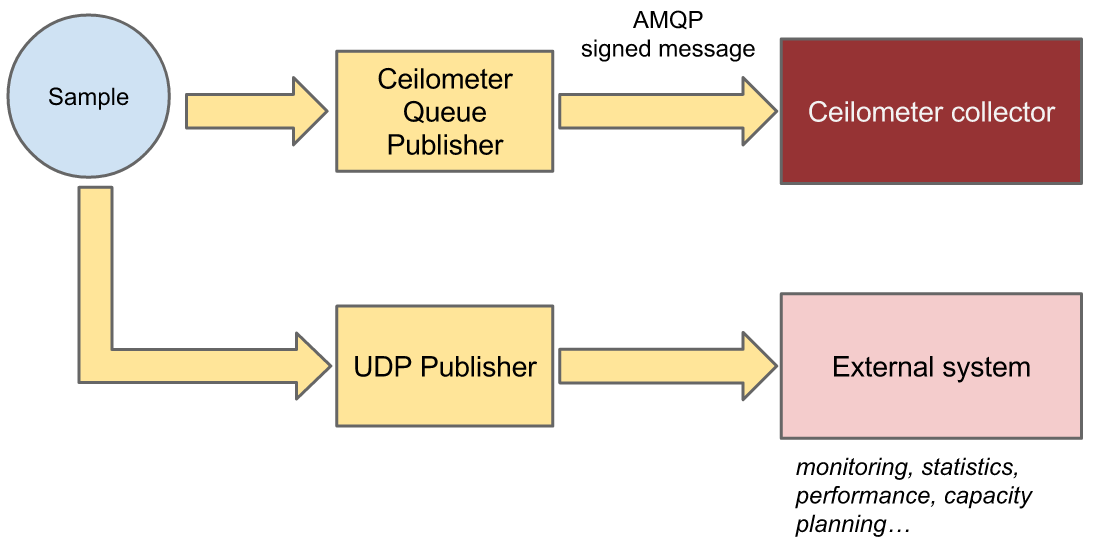
Currently, processed data can be published using 5 different transports: notifier, a notification based publisher which pushes samples to a message queue which can be consumed by the collector or an external system; udp, which publishes samples using UDP packets; http, which targets a REST interface; and kafka, which publishes data to a Kafka message queue to be consumed by any system that supports Kafka.
Storing the data
Collector Service
The collector daemon gathers the processed event and metering data captured by the notification and polling agents. It validates the incoming data and (if the signature is valid) then writes the messages to a declared target: database, file, gnocchi or http.
More details on database and Gnocchi targets can be found in the install guide.
Accessing the data
API Service
If the collected data from polling and notification agents are stored
in Ceilometer's database(s) (see the section choosing_db_backend), a REST
API is available to access the collected data rather than by accessing
the underlying database directly.
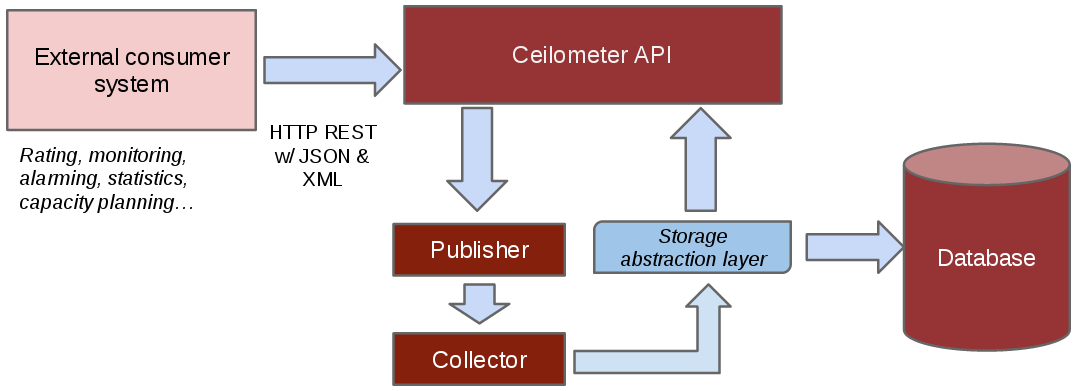
Moreover, end users can also send their own application specific data <user-defined-data>
into the database through the REST API for a various set of use
cases.