Edits the StackLight InfluxDB-Grafana plugin documentation.

This is the final PDF build:
https://drive.google.com/a/mirantis.com/file/d/0B30Lksc8WVCRM3NHWFpQLUpXOFE/view?usp=sharing

Change-Id: I604aa3f6f859fcc0e2d77a042a5513371a07dfc8
1.2 KiB
Introduction
The StackLight InfluxDB-Grafana Plugin for Fuel is used to install and configure InfluxDB and Grafana, which collectively provide access to the metrics analytics of Mirantis OpenStack. InfluxDB is a powerful distributed time-series database to store and search metrics time-series. The metrics analytics are used to visualize the time-series and the annotations produced by the StackLight Collector. The annotations contain insightful information about the faults and anomalies that resulted in a change of state for the clusters of nodes and services of the OpenStack environment.
The InfluxDB-Grafana plugin is an indispensable tool to answer the questions of what has changed in your OpenStack environment, when, and why. Grafana is installed with a collection of predefined dashboards for each of the OpenStack services that are monitored. Among those dashboards, the Main Dashboard provides a single pane of glass overview of your OpenStack environment status.
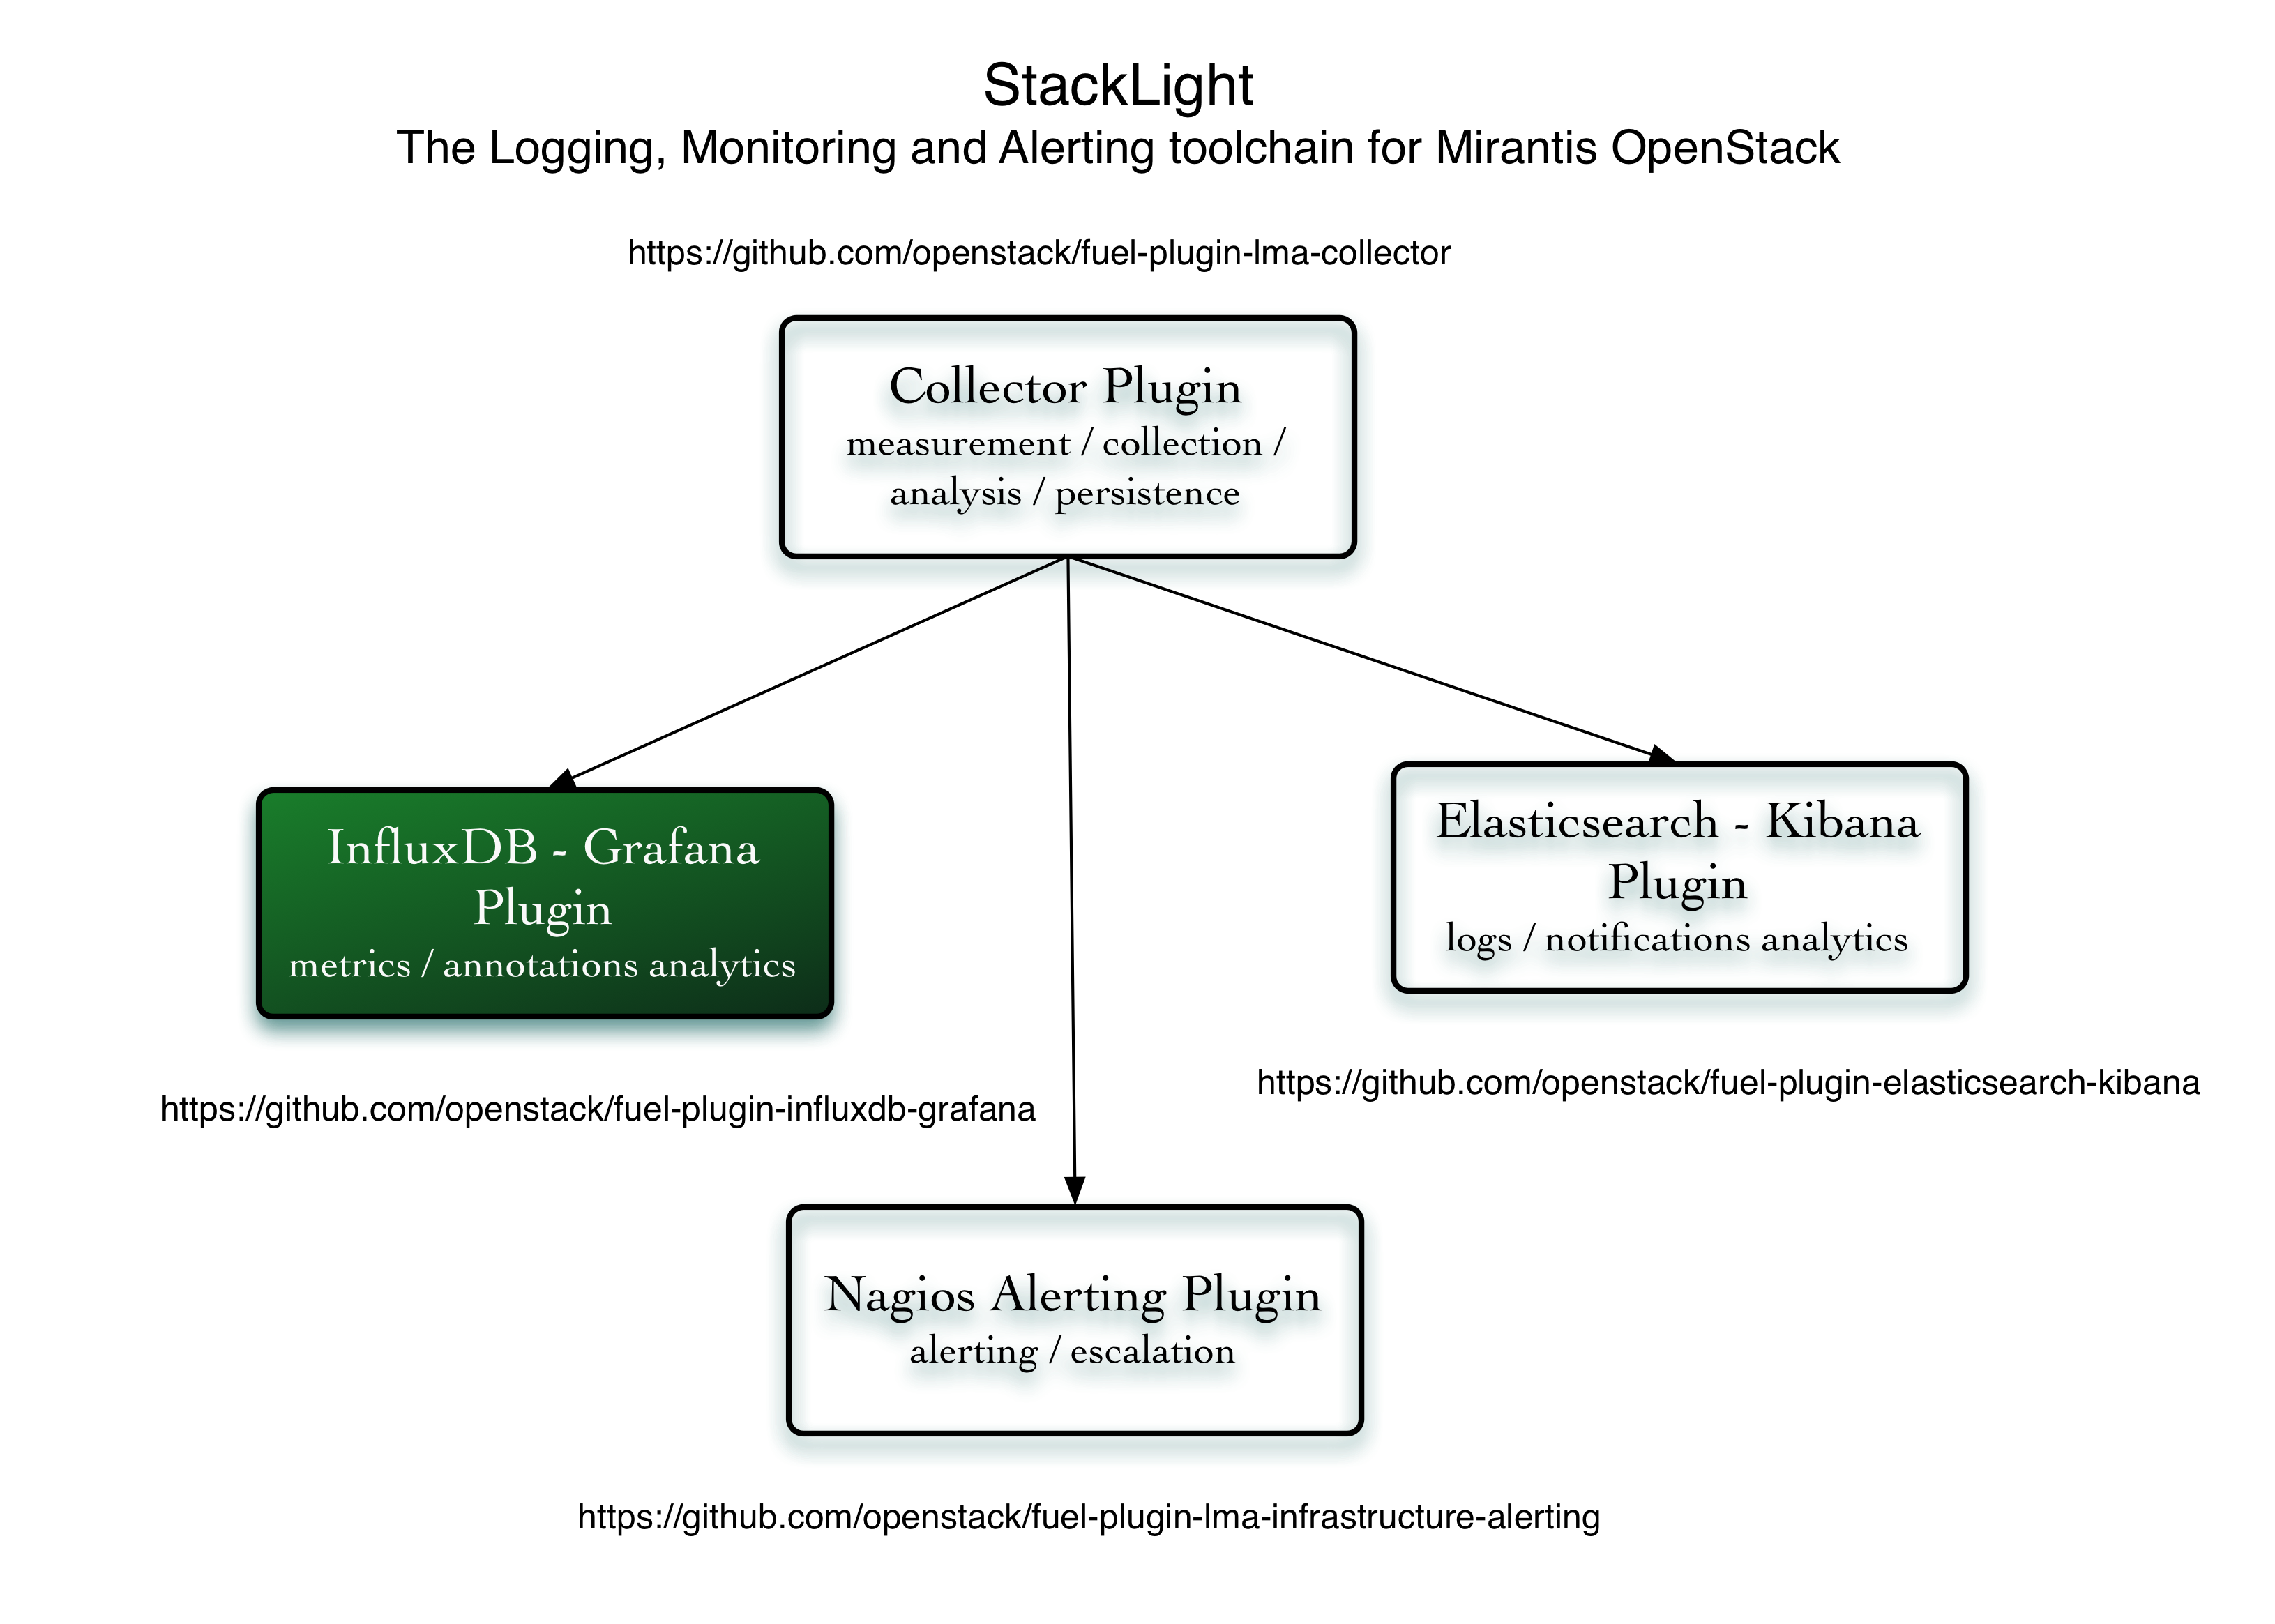
InfluxDB and Grafana are the key components of the LMA Toolchain project as shown in the figure below.
