3.2 KiB
Plugin verification
Depending on the number of nodes and deployment setup, deploying a Mirantis OpenStack environment may take 30 minutes to several hours. Once the deployment is complete, you should see a deployment success notification with a link to the Grafana web UI as shown below.
Verify InfluxDB
To verify that the InfluxDB cluster is running properly, first retrieve the InfluxDB cluster VIP address:
On the Fuel Master node, find the IP address of a node where the InfluxDB server is installed using the
fuel nodescommand. For example:[root@fuel ~]# fuel nodes id | status | name | cluster | ip | mac | roles | ---|----------|------------------|---------|------------|-----|------------------| 1 | ready | Untitled (fa:87) | 1 | 10.109.0.8 | ... | influxdb_grafana | 2 | ready | Untitled (12:aa) | 1 | 10.109.0.3 | ... | influxdb_grafana | 3 | ready | Untitled (4e:6e) | 1 | 10.109.0.7 | ... | influxdb_grafana |Log in to any of these nodes through SSH, for example, to
node-1Run the following command:
root@node-1:~# hiera lma::influxdb::vip
10.109.1.4
Where
10.109.1.4is the virtual IP address (VIP) of your InfluxDB cluster.Using that VIP address, run the following command:
root@node-1:~# /usr/bin/influx -database lma -password lmapass \
--username root -host 10.109.1.4 -port 8086
Visit https://enterprise.influxdata.com to register for updates,
InfluxDB server management, and monitoring.
Connected to http://10.109.1.4:8086 version 0.10.0
InfluxDB shell 0.10.0
>
The example above shows that executing
/usr/bin/influxstarts an interactive CLI and automatically connects to the InfluxDB server. Then run the following command:> show seriesYou should see a dump of all the time-series collected so far. Then run:
> show servers
name: data_nodes
----------------
id      http_addr       tcp_addr
1       node-1:8086     node-1:8088
3       node-2:8086     node-2:8088
5       node-3:8086     node-3:8088

name: meta_nodes
----------------
id      http_addr       tcp_addr
1       node-1:8091     node-1:8088
2       node-2:8091     node-2:8088
4       node-3:8091     node-3:8088
You should see a list of nodes participating in the InfluxDB cluster with their roles (data or meta).
Verify Grafana
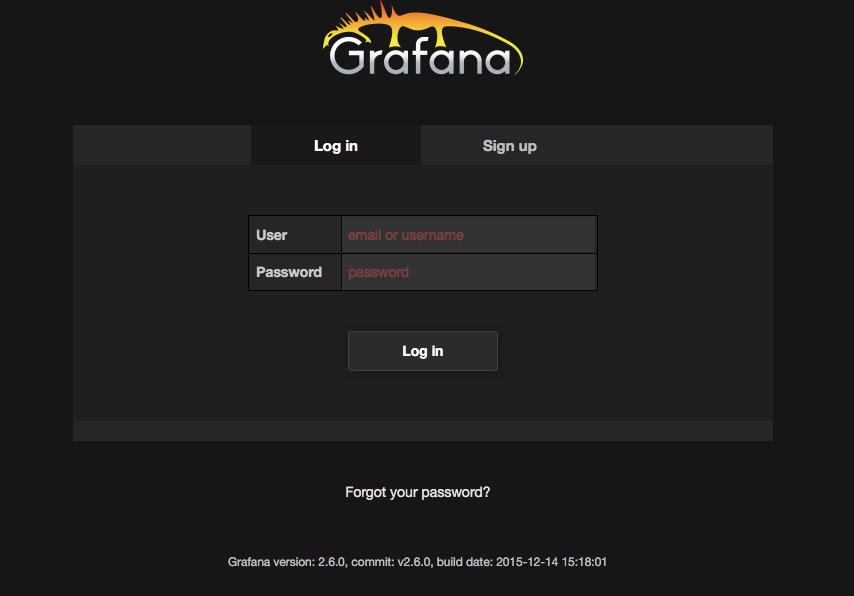
- Log in to the Fuel web UI.
- In the
Dashboardtab, clickGrafana. If your DNS is not set up, enter the IP address and the port number. - Authenticate using your credentials.
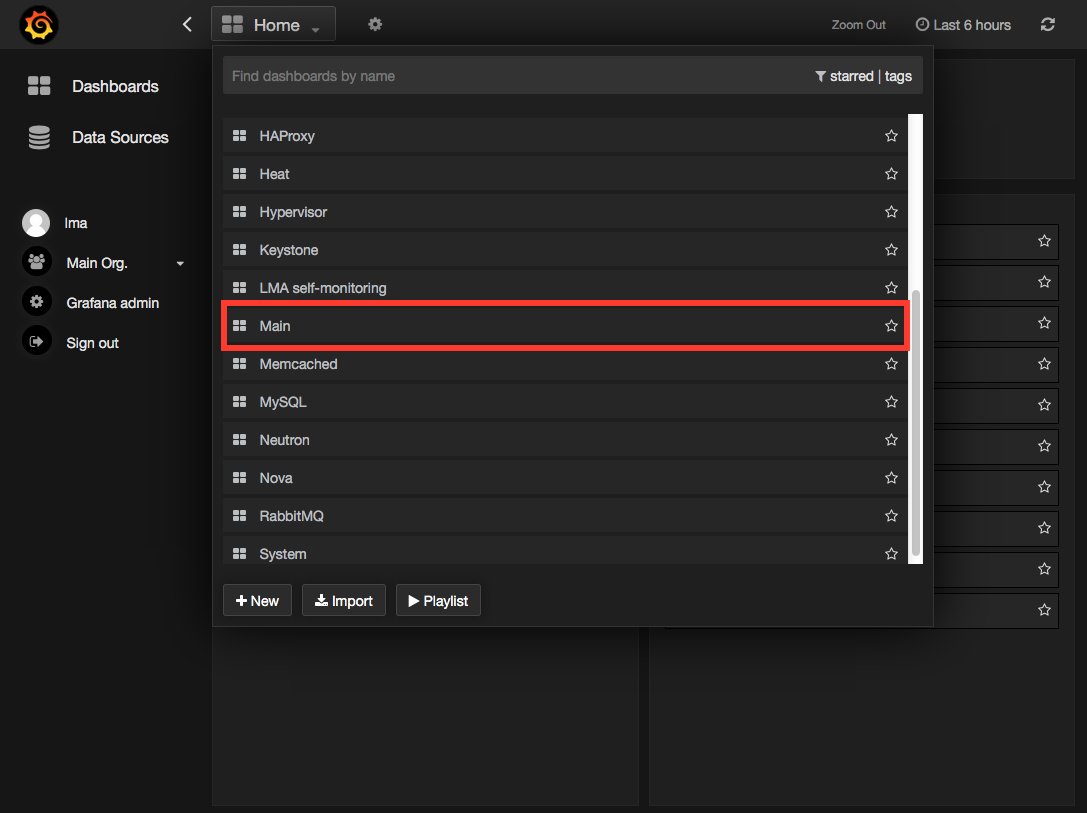
You should be redirected to the Grafana Home Page where you can select a
dashboard as shown below.


