7.9 KiB
Configuration Guide
Plugin configuration
To configure your plugin, you need to follow these steps:
- Create a new environment following the instructions of the Fuel User Guide.
- Click on the Settings tab of the Fuel web UI and select the Other category.
- Scroll down through the settings until you find the StackLight Collector Plugin section. You should see a page like this.
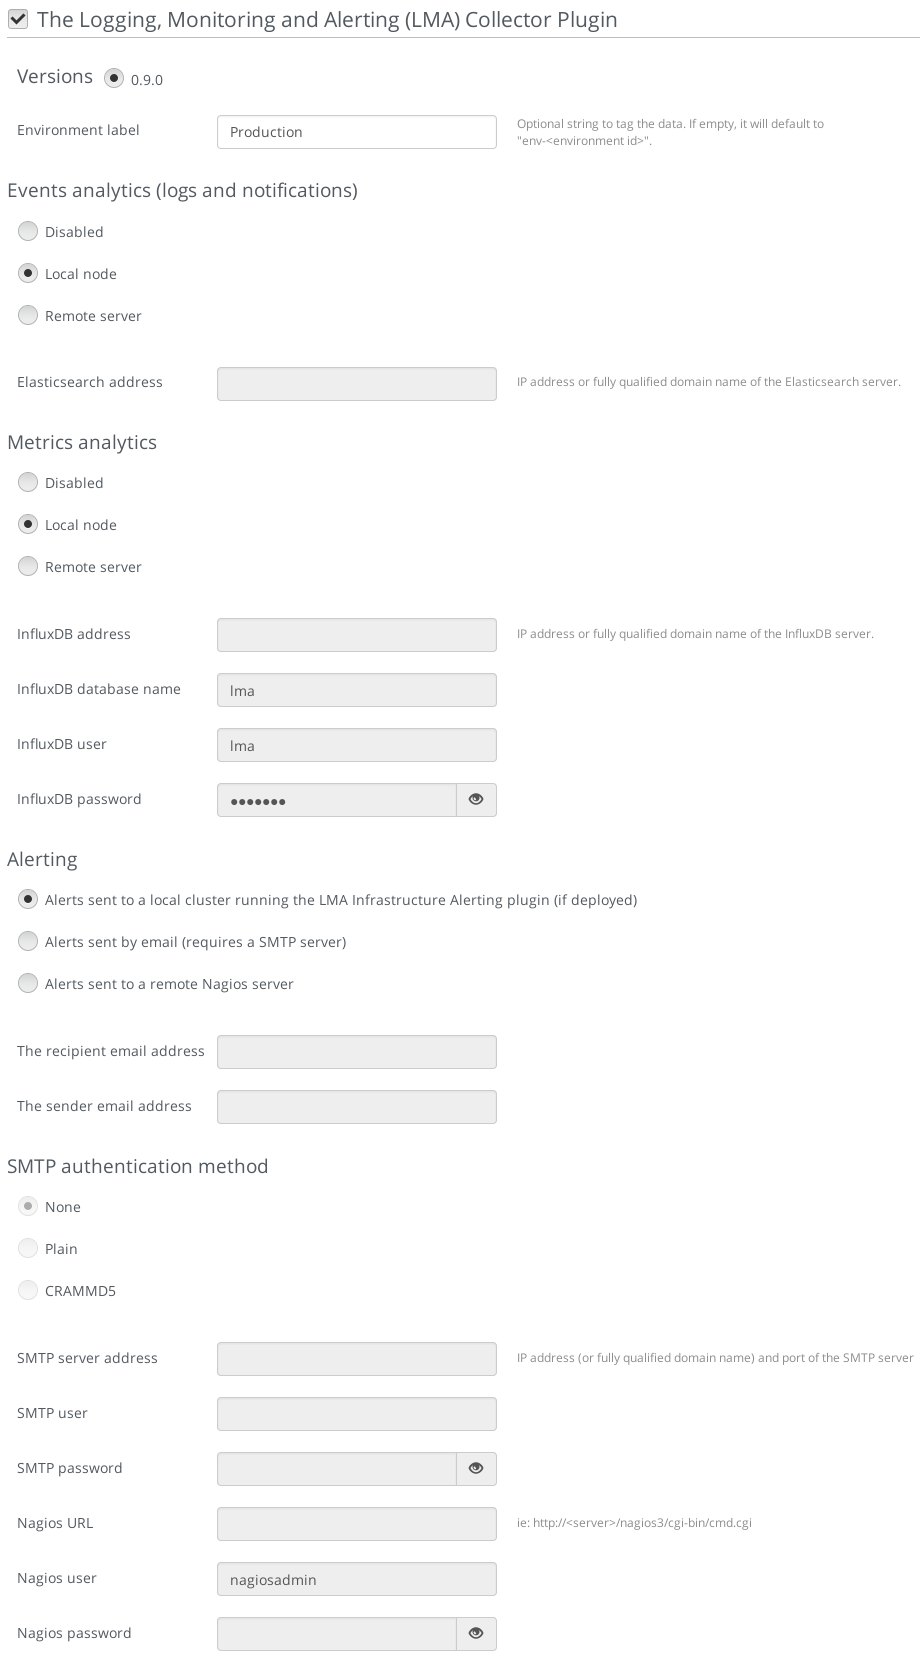
- Tick the StackLight Collector Plugin box and fill-in the required fields as indicated below.
- Provide an Environment Label of your choice to tag your data (optional).
- For the Events Analytics destination, select Local node if you plan to use the Elasticsearch-Kibana Plugin in the environment. Otherwise, select Remote server and specify the fully qualified name or IP address of an external Elasticsearch server.
- For the Metrics Analytics destination, select Local node if you plan to use the InfluxDB-Grafana Plugin in the environment. Otherwise, select Remote server and specify the fully qualified name or IP address of an external InfluxDB server. Then, specify the InfluxDB database name you want to use, a username and password that have read and write access permissions.
- For Alerting, select Alerts sent by email if you want to receive alerts sent by email from the Collector. Otherwise, select Alerts sent to a local cluster if you plan to use the Infrastructure Alerting Plugin (Nagios) in the environment. Alternatively, you can select Alerts sent to a remote Nagios server.
- For Alerts sent by email, you can specify the SMTP authentication method you want to use. Then, specify the SMTP server fully qualified name or IP address, the SMTP username and password who have the permissions to send emails.
- Finally, specify the Nagios server URL, username and password if you have chosen to send alerts to an external Nagios server.
- Configure your environment following the instructions of the Fuel User Guide.
Note
By default, StackLight is configured to use the management network, of the so called default node network group created by Fuel. While this default setup may be appropriate for small deployments or evaluation purposes, it is recommended not to use the default management network for StackLight but instead create a dedicated network when configuring your environement. This will improve the performance of both OpenStack and StackLight overall and facilitate the access to the Kibana and Grafana analytics.
- Deploy your environment following the instructions of the Fuel User Guide.
Note
The StackLight Collector Plugin is a hot-pluggable plugin which means that it is possible to install and deploy the collector in an environment that is already deployed. After the installation of the StackLight Collector Plugin, you will need to define the settings of the plugin and then run the command shown below from the Fuel master node for every node of your deployment. You need to start with the controller node(s):
[root@nailgun ~]# fuel nodes --env <env_id> --node <node_id> --start \post_deployment_start --tasks hiera
Plugin verification
Once the OpenStack environment is ready, you should check that both the collectd and hekad processes are running on the OpenStack nodes:
[root@node-1 ~]# pidof hekad
5568
5569
[root@node-1 ~]# pidof collectd
5684
Note
Starting with StackLight version 0.10, there is not one but two hekad processes running. One is used to collect and process the logs and the notifications, the other one is used to process the metrics.
Troubleshooting
If you see no data in the Kibana and/or Grafana dashboards, use the instructions below to troubleshoot the problem:
Check that the collector services are up and running:
# On the controller node(s)
[root@node-1 ~]# crm resource status metric_collector
[root@node-1 ~]# crm resource status log_collector

# On non controller nodes
[root@node-2 ~]# status log_collector
[root@node-2 ~]# status metric_collector
If a collector is down, restart it:
# On the controller node(s)
[root@node-1 ~]# crm resource start log_collector
[root@node-1 ~]# crm resource start metric_collector

# On non controller nodes
[root@node-2 ~]# start log_collector
[root@node-2 ~]# start metric_collector
Look for errors in the log file of the collectors (located at /var/log/log_collector.log and /var/log/metric_collector.log).
Look for errors in the log file of collectd (located at /var/log/collectd.log).
Check if the nodes are able to connect to the Elasticsearch server on port 9200.
Check if the nodes are able to connect to the InfluxDB server on port 8086.
Diagnostic Tool
A global diagnostic tool is installed on the Fuel Master node by the StackLight Collector Plugin. The global diagnostic tool checks that StackLight is configured and running properly across the entire LMA toolchain for all the nodes that ready in your OpenStack environment:
[root@nailgun ~]# /var/www/nailgun/plugins/lma_collector-<version>/contrib/tools/diagnostic.sh
Running lma_diagnostic tool on all available nodes (this can take several minutes)
The diagnostic archive is here: /var/lma_diagnostics.2016-06-10_11-23-1465557820.tgz
Note that a global diagnostic can take several minutes.
All the results are consolidated in an archive file with the name
/var/lma_diagnostics.[date +%Y-%m-%d_%H-%M-%s].tgz.
Instead of running a global diagnostic, you may want to run the diagnostic on individual nodes. The tool will figure out what checks should be executed based on the role of the node as shown below:
root@node-3:~# hiera roles
["controller"]

root@node-3:~# lma_diagnostics

2016-06-10-11-08-04 INFO node-3.test.domain.local role ["controller"]
2016-06-10-11-08-04 INFO ** LMA Collector
2016-06-10-11-08-04 INFO 2 process(es) 'hekad -config' found
2016-06-10-11-08-04 INFO 1 process(es) hekad is/are listening on port 4352
2016-06-10-11-08-04 INFO 1 process(es) hekad is/are listening on port 8325
2016-06-10-11-08-05 INFO 1 process(es) hekad is/are listening on port 5567
2016-06-10-11-08-05 INFO 1 process(es) hekad is/are listening on port 4353
[...]
In the example above, the diagnostic tool reports that two hekad processes are runing on node-3 which is the expected outcome. In the case where one hekad process is not be running, the diagnostic tool would report an error as shown below:
root@node-3:~# lma_diagnostics
2016-06-10-11-11-48 INFO node-3.test.domain.local role ["controller"]
2016-06-10-11-11-48 INFO ** LMA Collector
2016-06-10-11-11-48 **ERROR 1 'hekad -config' processes found, 2 expected!**
2016-06-10-11-11-48 **ERROR 'hekad' process does not LISTEN on port: 4352**
[...]
Here, two errors are reported:
- There is only one hekad process running instead of two.
- No hekad process is listening on port 4352.
This is one example of the type of checks performed by the diagnostic
tool but there are many others. On the OpenStack nodes, the diagnostic's
results are stored in
/var/lma_diagnostics/diagnostics.log.
A successful LMA toolchain diagnostic should be free of errors.