The following changes are introduced with this commit:
- edit commands output
- delete blank pages between sections
- make the resources requirements explicit with putting
them into Requirements section

Co-Authored-By: Irina Povolotskaya <ipovolotskaya@mirantis.com>
Co-Authored-By: Simon Pasquier <spasquier@mirantis.com>

Change-Id: I274f65902565ce3cf113de569c33e530cb94a3a0
12 KiB
User Guide
Plugin configuration
To configure your plugin, you need to follow these steps:
Create a new environment with the Fuel web user interface.
Click on the Settings tab of the Fuel web UI.
Scroll down the page and select the LMA Infrastructure Alerting Plugin in the left column. The LMA Infrastructure Alerting Plugin settings screen should appear as shown below.
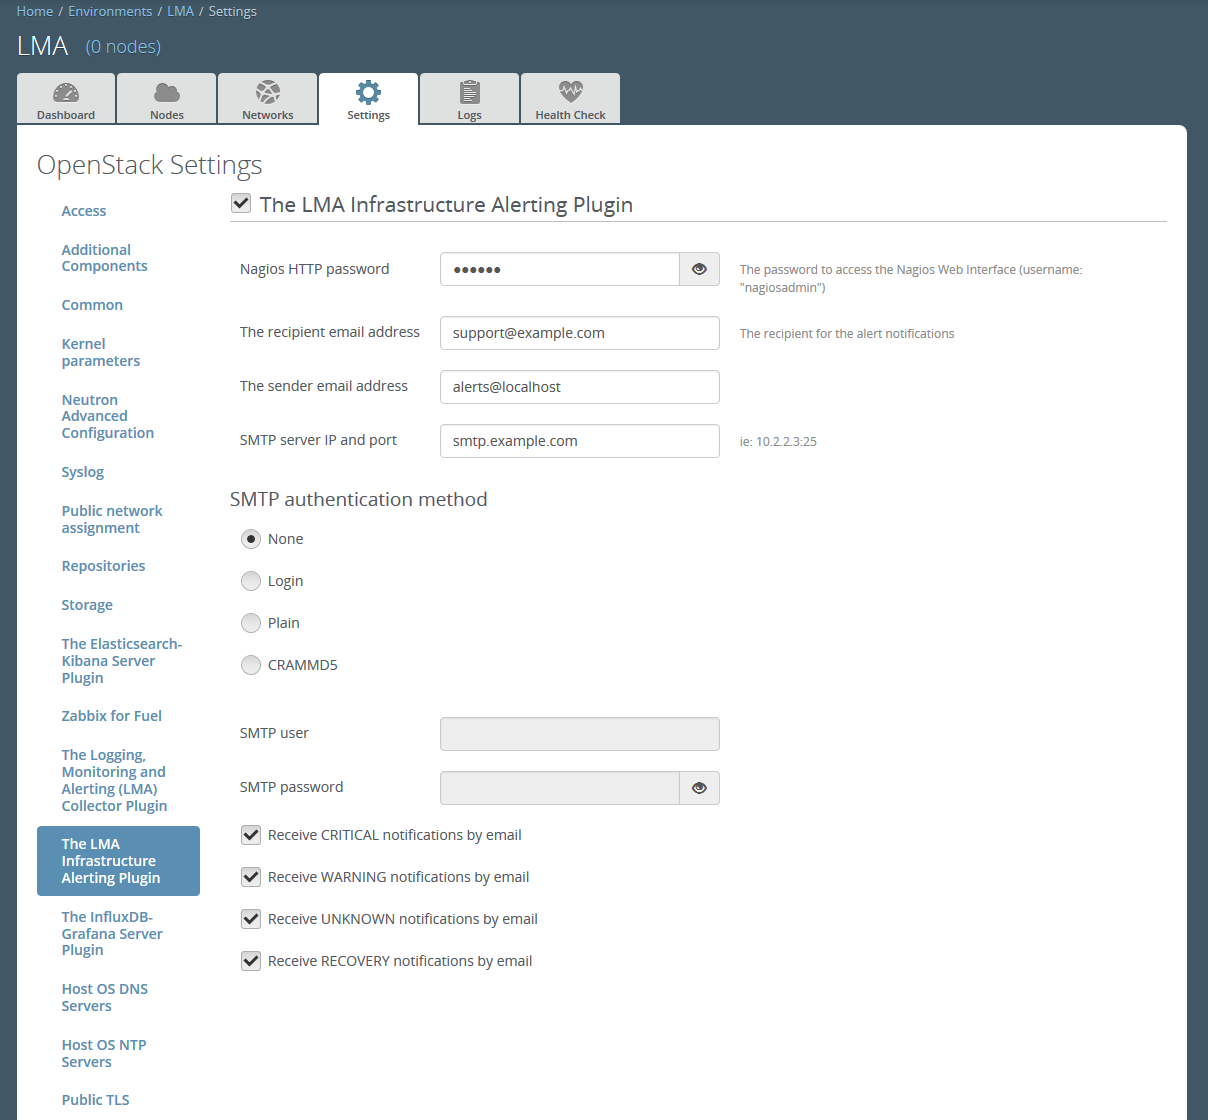
Select the LMA Infrastructure Alerting Plugin checkbox and fill-in the required fields.
- Change the nagiosadmin password (optional).
- Specify the recipient email address for the alerts.
- Specify the sender email address for the alerts.
- Specify the SMTP server address and port.
- Specify the SMTP authentication method.
- Specify the SMTP username and password (required if the authentication method isn't 'None').
- Specify which types of notification should be sent by email.
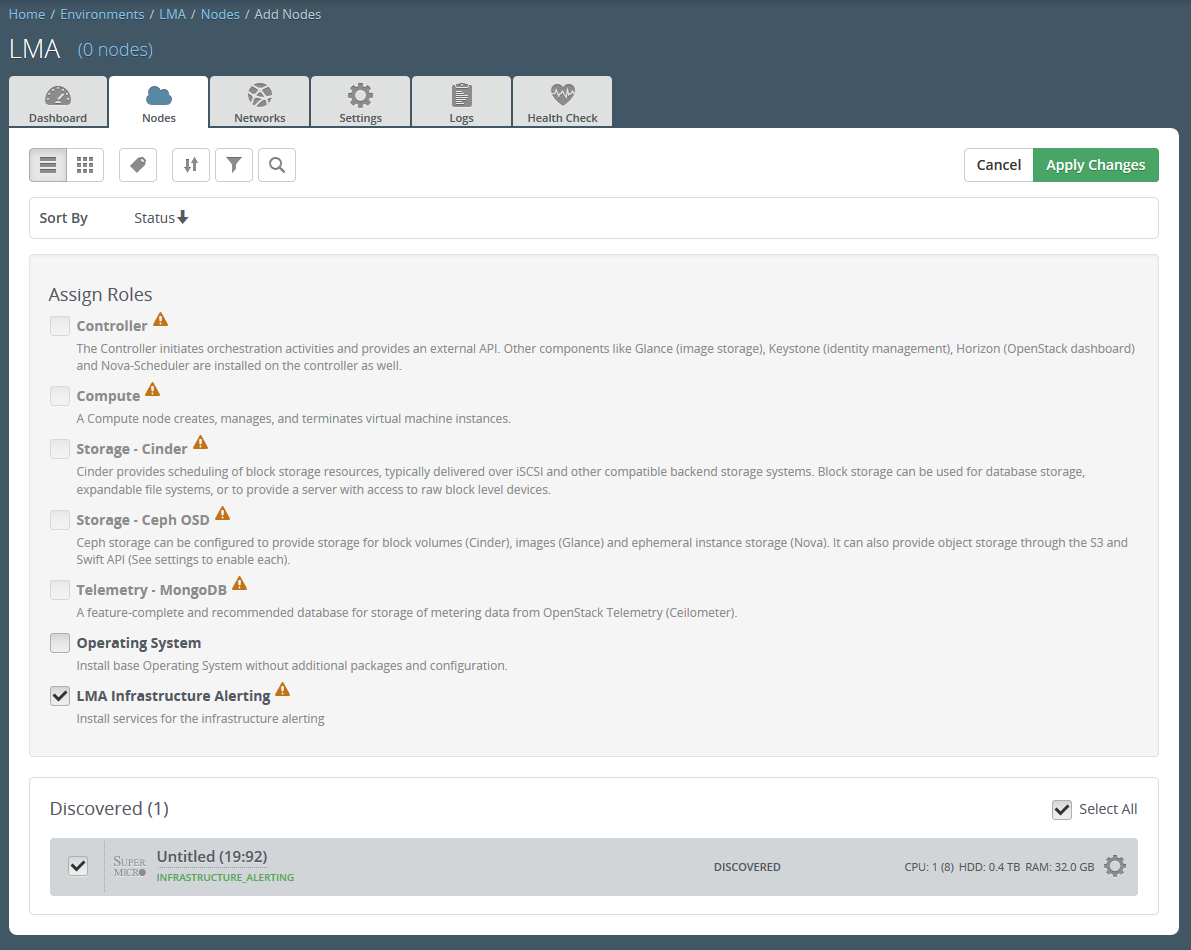
Assign the LMA Infrastructure Alerting role to a node as shown in the figure below.
Note
Because of a bug with Fuel 7.0 (see bug #1496328), the UI won't let you assign the LMA Infrastructure Alerting role if at least one node is already assigned with one of the built-in roles.
To workaround this problem, you should either remove the already assigned built-in roles or use the Fuel CLI:
$ fuel --env <environment id> node set \
--node-id <node_id> --role=infrastructure_alerting
Please take into consideration the information on the disks partitioning. By default, the LMA Infrastructure Alerting Plugin allocates:
- 20% of the first available disk for the operating system by honoring a range of 15GB minimum and 50GB maximum.
- 10GB for /var/log.
- At least 20 GB for the Nagios data in /var/nagios.
Please check the Fuel User Guide if you would like to change the default configuration of the disks partitioning.
Configure your environment as needed.
Verify the networks on the Networks tab of the Fuel web UI.
Deploy your changes.
Plugin verification
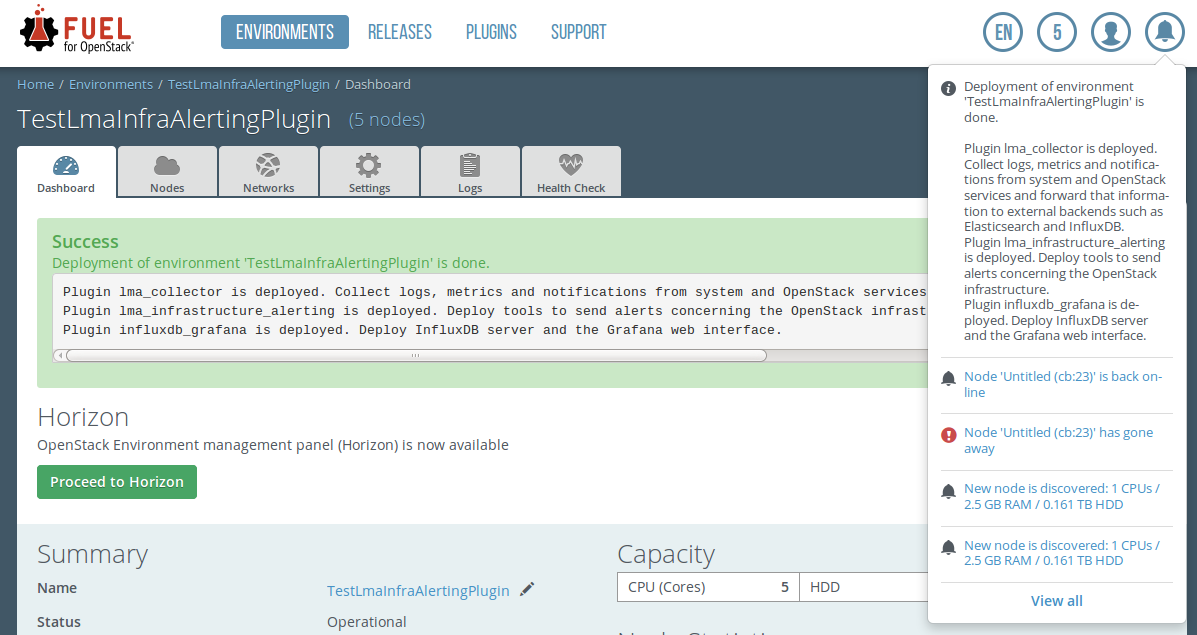
Be aware, that depending on the number of nodes and deployment setup, deploying a Mirantis OpenStack environment can typically take anything from 30 minutes to several hours. But once your deployment is complete, you should see a notification that looks like the following:
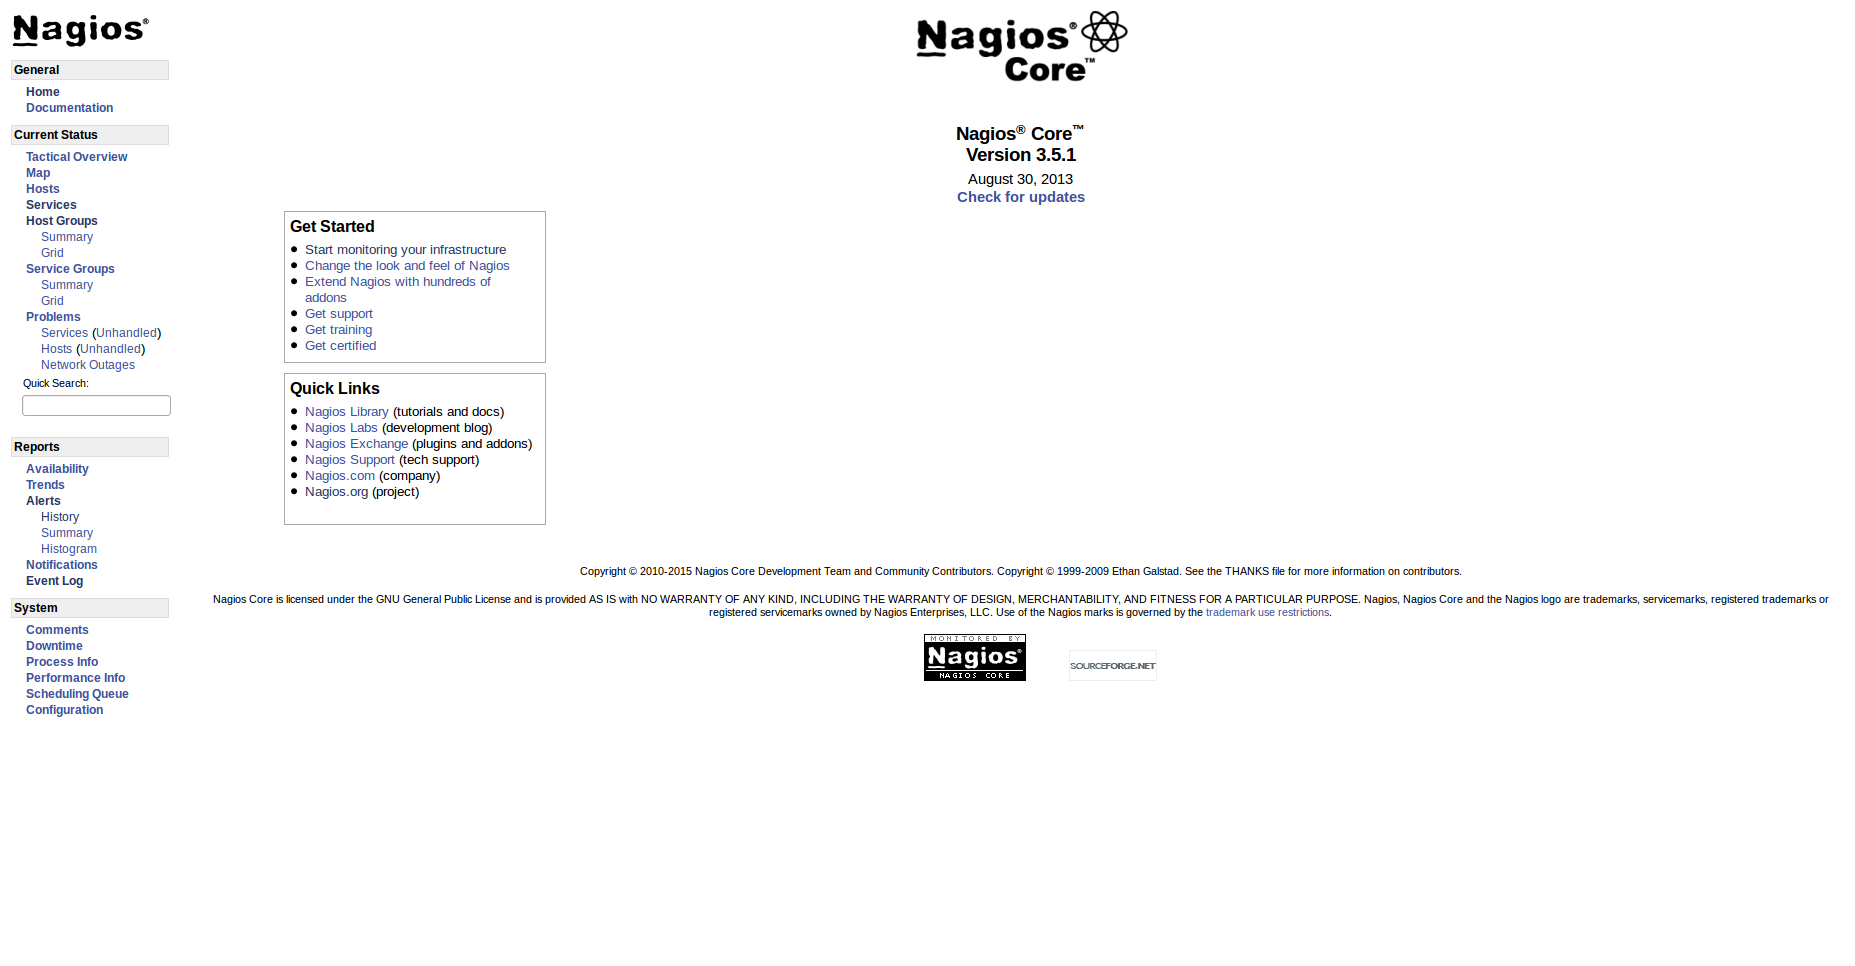
Once your deployment has completed, you should verify that Nagios is installed properly through checking its URL:
http://<HOST>:8001/Where HOST is the IP address of the node which runs the Nagios server.
Note
You can retrieve the IP address where Nagios is installed using the fuel command line:
[root@fuel ~]# fuel nodesid | status | name | cluster | ip | mac .... -------------------------------- ready | Untitled (20:0c) | 8 | 10.20.0.8 | 08:00:27:29:20:0c .... 13 | ready | Untitled (47:b7) | 8 | 10.20.0.4 | 08:00:27:54:47:b7 ....
... | roles | pending_roles | online | group_id ... ------------------------... | controller | | True | 8 ... | lma_infrastructure_alerting | | True | 8
Once you have authenticated to the Nagios UI (the username is
nagiosadmin and the password is defined in the settings of
the plugin), you should get to this page:
Managing Nagios
You can get the current status of the OpenStack environment by clicking on the Services menu item:
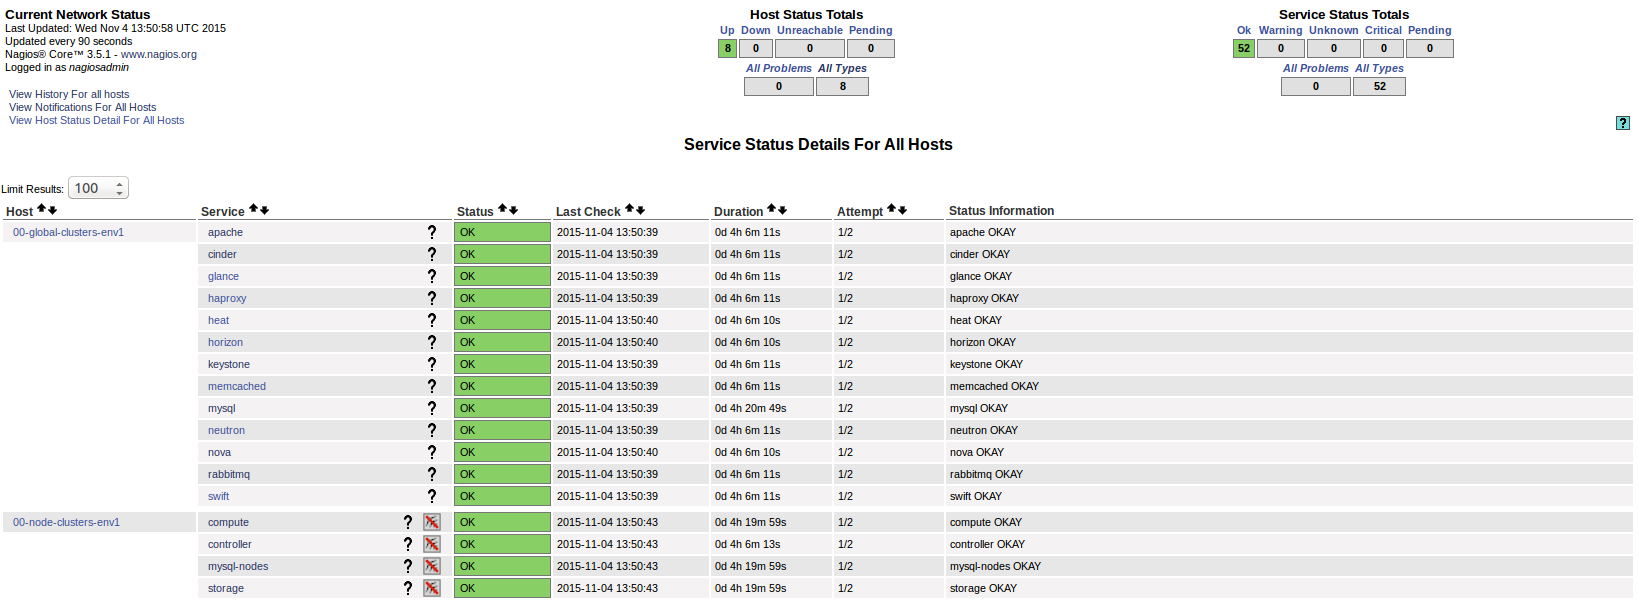
The LMA Infrastructure Alerting plugin has provisioned Nagios with all the hosts and services that have been deployed in the environment. The alarms (or service checks in Nagios vocabulary) are configured in passive mode because they are received from the LMA collectors and aggregator (see the LMA Collector documentation for more details).
Note
Notifications for system and node cluster alarms are disabled by default because they can be triggered often while not affecting the overall health of the OpenStack services. If you want to enable notifications for a particular service, go to the service's details page and click on the 'Enable notifications for this service' link in the 'Service Commands' panel.
There are also two virtual hosts representing the service and node clusters:
- 00-global-clusters-env${ENVID} for the service clusters like the Nova cluster, the Keystone cluster, the RabbiMQ cluster and so on.
- 00-node-clusters-env${ENVID} for the physical node clusters like the cluster of controller nodes, the cluster of storage nodes and so on.
These additional 2 entities offer the high-level view on the healthiness of the OpenStack environment.
Configuring service checks on InfluxDB metrics
You could configure addtional alarms (other than those already defined in the LMA Collector) based on the metrics stored in the InfluxDB database. For instance, if you wanted to be alerted when the system CPU usage of the Elasticsearch process reaches a certain threshold, you could setup a 'warning' alarm at say 30% of CPU usage threshold and a 'criticial' alarm at 50% of CPU usage threshold. The steps to define those alarms in Nagios would be as follow:
Connect to the LMA Infrastructure Alerting node.
Install the Nagios plugin for querying InfluxDB:
[root@node-13 ~]# pip install influx-nagios-pluginDefine the command and the service check in the
/etc/nagios3/conf.d/influxdb_services.conffile:# Replace <INFLUXDB_HOST>, <INFLUXDB_USER> and <INFLUXDB_PASSWORD> by # the appropriate values for your deployment define command { command_line /usr/local/bin/check_influx \ -h <INFLUXDB_HOST> -u <INFLUXDB_USER> -p <INFLUXDB_PASSWORD> -d lma \ -q "select max(value) from lma_components_cputime_syst \ where time > now() - 5m and service='$ARG1$' \ group by time(5m) limit 1" \ -w $ARG2$ -c $ARG3$ command_name check_cpu_metric } define service { service_description Elasticsearch system CPU host node-13 check_command check_cpu_metric!elasticsearch!30!50: use generic-service }Verify that the Nagios configuration is valid:
[root@node-13 ~]# nagios3 -v /etc/nagios3/nagios.cfg

   [snip]

Total Warnings: 0
Total Errors:   0

Things look okay - No serious problems were detected during the pre-flight check
Restart the Nagios server:
[root@node-13 ~]# /etc/init.d/nagios3 restartGo the Nagios dashboard and verify that the service check has been added.
From there, you can define additional service checks for different
hosts or hostgroups using the same check_influx command.
You just need to provide the 3 required arguments when defining the
service checks:
- A valid InfluxDB query that should return only one row with a single value. Check the InfluxDB documentation to learn how to use InfluxDB query language.
- A range specification for the warning threshold.
- A range specification for the critical threshold.
Using an external SMTP server with STARTTLS
If your SMTP server requires the use of STARTTLS, you need to make some manual adjustements to the Nagios configuration after the deployment of the environment has completed. To enable STARTTLS, you should have configured the SMTP Authentication method to use either to Plain, Login or CRAM-MD5 first.
Note
Future versions of the LMA Infrastructure Alerting plugin will support the configuration of STARTTLS from the Fuel UI.
Login to the LMA Infrastructure Alerting node.
Edit the
/etc/nagios3/conf.d/cmd_notify-service-by-smtp-with-long-service-output.cfgfile to add the-S smtp-use-starttlsoption to the mail command. For instance:define command{ command_name notify-service-by-smtp-with-long-service-output command_line /usr/bin/printf "%b" "***** Nagios *****\n\n"\ "Notification Type: $NOTIFICATIONTYPE$\n\n"\ "Service: $SERVICEDESC$\nHost: $HOSTALIAS$\nAddress: $HOSTADDRESS$\n"\ "State: $SERVICESTATE$\n\nDate/Time: $LONGDATETIME$\n\n"\ "Additional Info:\n\n$SERVICEOUTPUT$\n$LONGSERVICEOUTPUT$\n" | \ /usr/bin/mail -s "** $NOTIFICATIONTYPE$ "\ "Service Alert: $HOSTALIAS$/$SERVICEDESC$ is $SERVICESTATE$ **" \ -r 'nagios@localhost' \ -S smtp="smtp://<SMTP_HOST>" \ -S smtp-auth=<SMTP_AUTH_METHOD> \ -S smtp-auth-user='<SMTP_USER>' \ -S smtp-auth-password='<SMTP_PASSWORD>' \ -S smtp-use-starttls \ $CONTACTEMAIL$ }Note
If the server certificate isn't present in the standard directory (eg
/etc/ssl/certson Ubuntu), you can specify its location by adding the-S ssl-ca-file=<FILE>option.If you want to disable the verification of the SSL/TLS server certificate altogether, you should add the
-S ssl-verify=ignoreoption instead.Verify that the Nagios configuration is correct:
[root@node-13 ~]# nagios3 -v /etc/nagios3/nagios.cfgRestart the Nagios service:
[root@node-13 ~]# /etc/init.d/nagios3 restart
Troubleshooting
If you cannot access the Nagios UI, check the following:
Check if the nodes are able to connect to the Nagios server on port 8001.
Check the Nagios configuration is valid:
[root@node-13 ~]# nagios3 -v /etc/nagios3/nagios.cfg

   [snip]

Total Warnings: 0
Total Errors:   0

Things look okay - No serious problems were detected during the pre-flight check
Check that the Nagios server is up and running:
[root@node-13 ~]# /etc/init.d/nagios3 statusIf Nagios is down, start it:
[root@node-13 ~]# /etc/init.d/nagios3 startCheck if Apache is up and running:
[root@node-13 ~]# /etc/init.d/apache2 statusIf Apache is down, start it:
[root@node-13 ~]# /etc/init.d/apache2 start
If Nagios reports some hosts or services as 'UNKNOWN: No data received for at least X seconds ', it indicates that the LMA collector fails to communicate with the Nagios service:
- First, check that the LMA Collector is running properly on these nodes by following the troubleshooting instructions of the LMA Collector Fuel Plugin User Guide.
- Check if the nodes are able to connect to the Nagios server on port 8001.
If Nagios reports some hosts or services as 'UNKNOWN: No datapoint have been received ever' or 'UNKNOWN: No datapoint have been received over the last X seconds ', it indicates that the LMA collector fails to determine the status of the service because either the alarm rule is misconfigured or no metric is received. In both cases, follow the the troubleshooting instructions of the LMA Collector Fuel Plugin User Guide.