1.9 KiB
Configure the plugin
Once installed, configure the OpenStack Telemetry plugin.
To configure the OpenStack Telemetry plugin:
Log in to the Fuel web UI.
Verify that the Telemetry plugin is listed in the
Pluginstab:
Create an OpenStack environment as described in the Fuel User Guide or use an existing one.
To enable the plugin, navigate to the
Environmentstab and selectThe OpenStack Telemetry Plugin: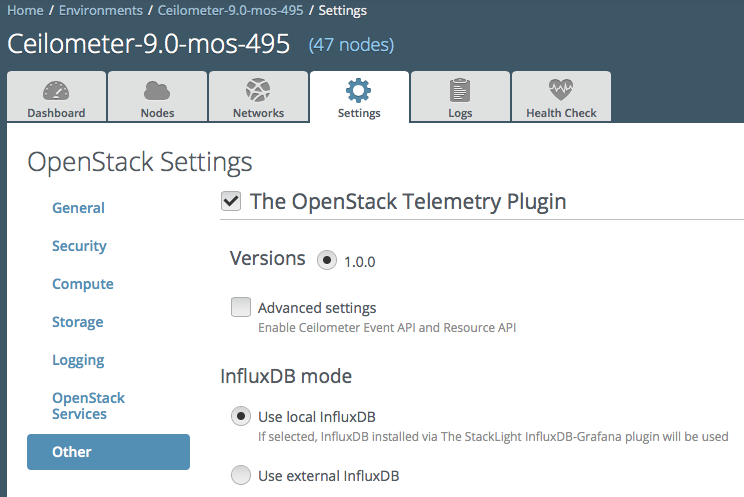
Optional. To enable Event API and Resource API, select
Advanced Settings: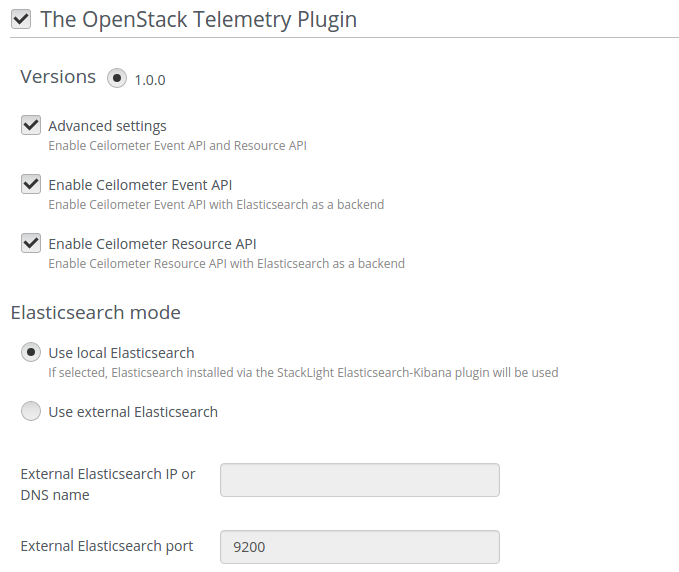
Once selected, configure the Elasticsearch cluster that stores Ceilometer events and resources:
- Select
Use local Elasticsearchif you have deployed the Elasticsearch-Kibana plugin. - Otherwise, select
Use External Elasticsearchand define the IP or DNS name and port for the Elasticsearch cluster you want to use.
- Select
Configure InfluxDB:
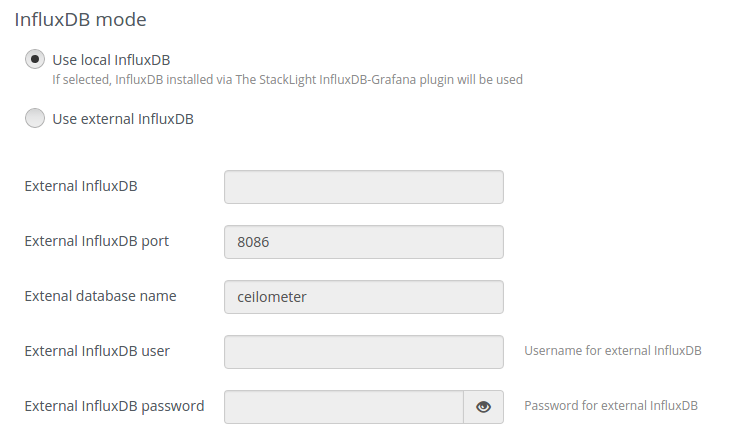
- Select
Use local InfluxDBif you have deployed the InfluxDB-Grafana plugin. - Otherwise, select
Use External InfluxDBand define the IP or DNS name, port, database name, username, and password for the InfluxDB server you want to use to store the Ceilometer-related data.
- Select
Configure additional metadata to be stored along with Ceilometer samples in InfluxDB:
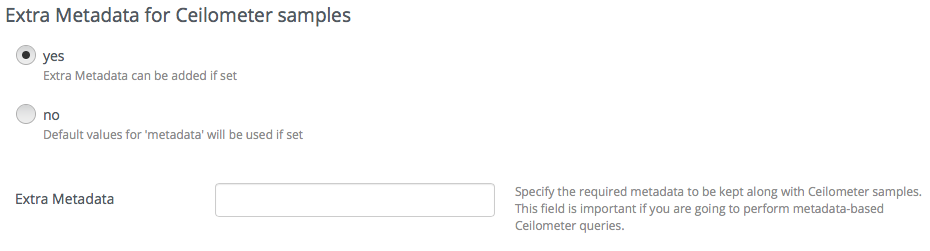
By default, the Telemetry plugin keeps the list of metadata fields described in the
limitationssection. If this list is not sufficient, add the names of metadata fields.